New Zealander vs Asian 4th Grade
COMPARE
New Zealander
Asian
4th Grade
4th Grade Comparison
New Zealanders
Asians
98.0%
4TH GRADE
99.6/ 100
METRIC RATING
67th/ 347
METRIC RANK
97.1%
4TH GRADE
1.4/ 100
METRIC RATING
242nd/ 347
METRIC RANK
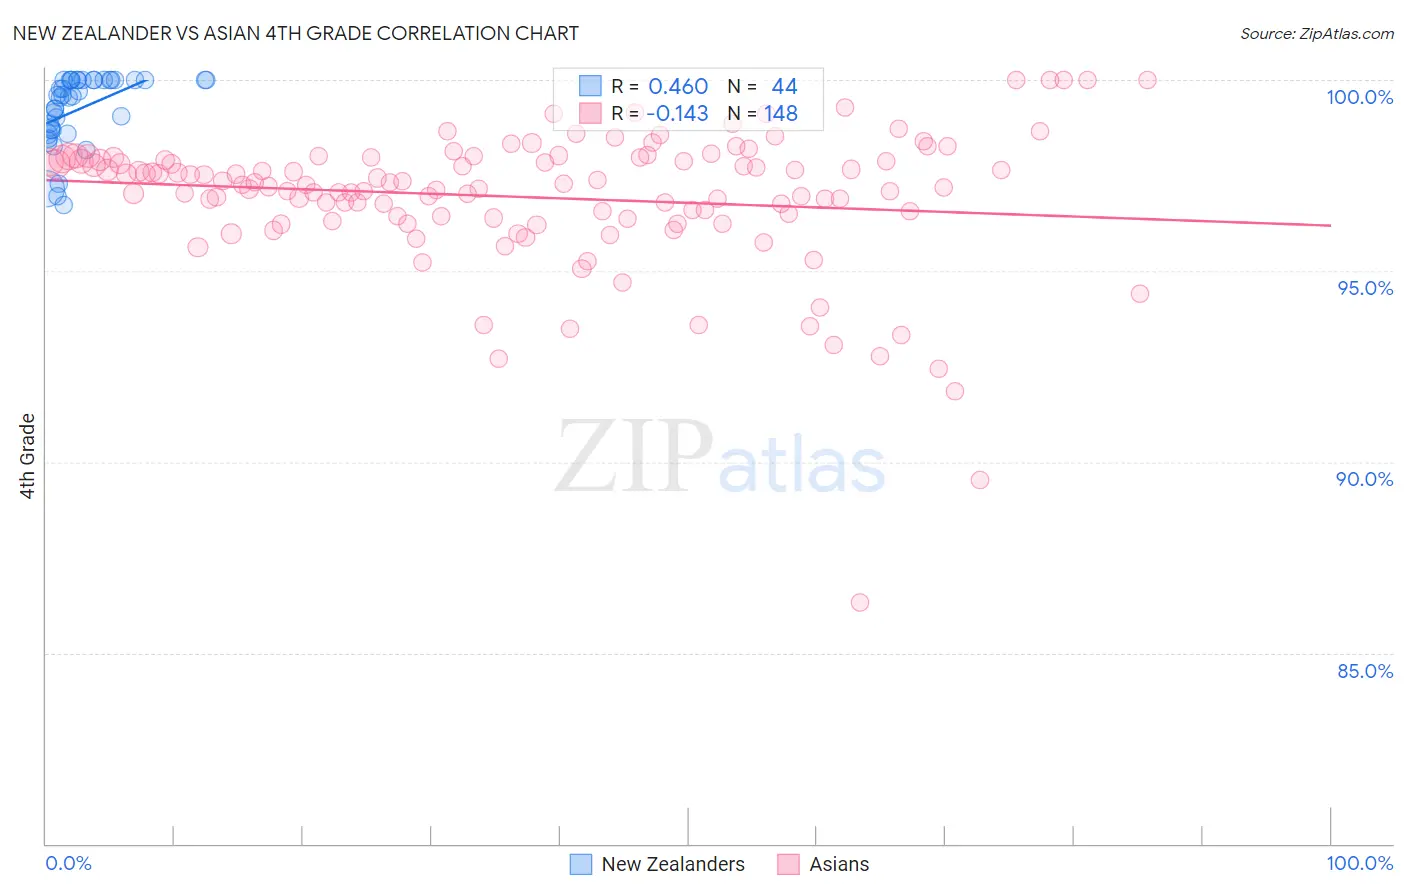
New Zealander vs Asian 4th Grade Correlation Chart
The statistical analysis conducted on geographies consisting of 106,912,544 people shows a moderate positive correlation between the proportion of New Zealanders and percentage of population with at least 4th grade education in the United States with a correlation coefficient (R) of 0.460 and weighted average of 98.0%. Similarly, the statistical analysis conducted on geographies consisting of 550,860,618 people shows a poor negative correlation between the proportion of Asians and percentage of population with at least 4th grade education in the United States with a correlation coefficient (R) of -0.143 and weighted average of 97.1%, a difference of 0.93%.
4th Grade Correlation Summary
| Measurement | New Zealander | Asian |
| Minimum | 96.7% | 86.3% |
| Maximum | 100.0% | 100.0% |
| Range | 3.3% | 13.7% |
| Mean | 99.2% | 96.9% |
| Median | 99.6% | 97.3% |
| Interquartile 25% (IQ1) | 98.7% | 96.4% |
| Interquartile 75% (IQ3) | 100.0% | 97.9% |
| Interquartile Range (IQR) | 1.3% | 1.5% |
| Standard Deviation (Sample) | 0.92% | 1.9% |
| Standard Deviation (Population) | 0.91% | 1.9% |
Similar Demographics by 4th Grade
Demographics Similar to New Zealanders by 4th Grade
In terms of 4th grade, the demographic groups most similar to New Zealanders are Immigrants from Northern Europe (98.0%, a difference of 0.0%), Canadian (98.0%, a difference of 0.0%), Cajun (98.0%, a difference of 0.010%), Kiowa (98.0%, a difference of 0.010%), and Pueblo (98.0%, a difference of 0.010%).
| Demographics | Rating | Rank | 4th Grade |
| Immigrants | Canada | 99.7 /100 | #60 | Exceptional 98.1% |
| Immigrants | North America | 99.7 /100 | #61 | Exceptional 98.1% |
| Serbians | 99.7 /100 | #62 | Exceptional 98.1% |
| Russians | 99.7 /100 | #63 | Exceptional 98.0% |
| Cajuns | 99.7 /100 | #64 | Exceptional 98.0% |
| Immigrants | Northern Europe | 99.6 /100 | #65 | Exceptional 98.0% |
| Canadians | 99.6 /100 | #66 | Exceptional 98.0% |
| New Zealanders | 99.6 /100 | #67 | Exceptional 98.0% |
| Kiowa | 99.6 /100 | #68 | Exceptional 98.0% |
| Pueblo | 99.6 /100 | #69 | Exceptional 98.0% |
| Immigrants | Austria | 99.6 /100 | #70 | Exceptional 98.0% |
| Lumbee | 99.6 /100 | #71 | Exceptional 98.0% |
| Iranians | 99.4 /100 | #72 | Exceptional 98.0% |
| Macedonians | 99.4 /100 | #73 | Exceptional 98.0% |
| Chickasaw | 99.4 /100 | #74 | Exceptional 98.0% |
Demographics Similar to Asians by 4th Grade
In terms of 4th grade, the demographic groups most similar to Asians are U.S. Virgin Islander (97.1%, a difference of 0.0%), Colombian (97.1%, a difference of 0.010%), Immigrants from Indonesia (97.1%, a difference of 0.010%), Korean (97.1%, a difference of 0.010%), and Immigrants from Eastern Africa (97.1%, a difference of 0.010%).
| Demographics | Rating | Rank | 4th Grade |
| Yuman | 2.9 /100 | #235 | Tragic 97.2% |
| Immigrants | Eastern Asia | 2.7 /100 | #236 | Tragic 97.2% |
| Immigrants | Costa Rica | 2.0 /100 | #237 | Tragic 97.2% |
| Indians (Asian) | 1.9 /100 | #238 | Tragic 97.2% |
| Nigerians | 1.8 /100 | #239 | Tragic 97.1% |
| Colombians | 1.6 /100 | #240 | Tragic 97.1% |
| Immigrants | Indonesia | 1.5 /100 | #241 | Tragic 97.1% |
| Asians | 1.4 /100 | #242 | Tragic 97.1% |
| U.S. Virgin Islanders | 1.4 /100 | #243 | Tragic 97.1% |
| Koreans | 1.3 /100 | #244 | Tragic 97.1% |
| Immigrants | Eastern Africa | 1.2 /100 | #245 | Tragic 97.1% |
| Immigrants | Uruguay | 1.2 /100 | #246 | Tragic 97.1% |
| Ethiopians | 1.2 /100 | #247 | Tragic 97.1% |
| Immigrants | Asia | 1.2 /100 | #248 | Tragic 97.1% |
| Immigrants | Africa | 1.0 /100 | #249 | Tragic 97.1% |