New Zealander vs Immigrants from Uzbekistan In Labor Force | Age 30-34
COMPARE
New Zealander
Immigrants from Uzbekistan
In Labor Force | Age 30-34
In Labor Force | Age 30-34 Comparison
New Zealanders
Immigrants from Uzbekistan
85.0%
IN LABOR FORCE | AGE 30-34
89.5/ 100
METRIC RATING
133rd/ 347
METRIC RANK
84.7%
IN LABOR FORCE | AGE 30-34
49.1/ 100
METRIC RATING
176th/ 347
METRIC RANK
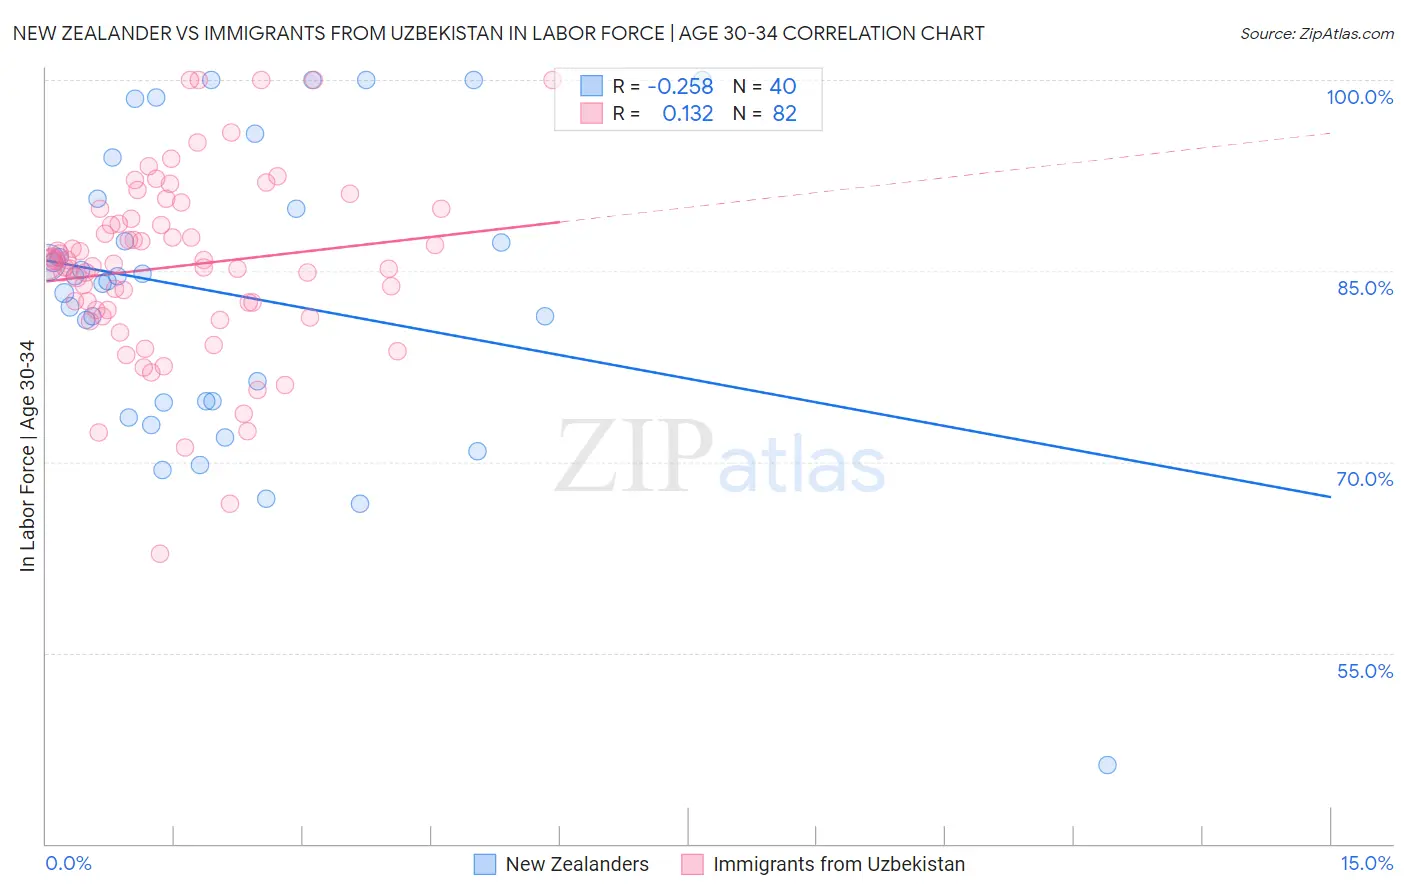
New Zealander vs Immigrants from Uzbekistan In Labor Force | Age 30-34 Correlation Chart
The statistical analysis conducted on geographies consisting of 106,910,408 people shows a weak negative correlation between the proportion of New Zealanders and labor force participation rate among population between the ages 30 and 34 in the United States with a correlation coefficient (R) of -0.258 and weighted average of 85.0%. Similarly, the statistical analysis conducted on geographies consisting of 118,740,878 people shows a poor positive correlation between the proportion of Immigrants from Uzbekistan and labor force participation rate among population between the ages 30 and 34 in the United States with a correlation coefficient (R) of 0.132 and weighted average of 84.7%, a difference of 0.38%.
In Labor Force | Age 30-34 Correlation Summary
| Measurement | New Zealander | Immigrants from Uzbekistan |
| Minimum | 46.2% | 62.8% |
| Maximum | 100.0% | 100.0% |
| Range | 53.8% | 37.2% |
| Mean | 83.1% | 85.3% |
| Median | 84.4% | 85.5% |
| Interquartile 25% (IQ1) | 74.7% | 81.9% |
| Interquartile 75% (IQ3) | 90.3% | 89.1% |
| Interquartile Range (IQR) | 15.6% | 7.2% |
| Standard Deviation (Sample) | 11.7% | 7.1% |
| Standard Deviation (Population) | 11.6% | 7.1% |
Similar Demographics by In Labor Force | Age 30-34
Demographics Similar to New Zealanders by In Labor Force | Age 30-34
In terms of in labor force | age 30-34, the demographic groups most similar to New Zealanders are Chinese (85.0%, a difference of 0.0%), Immigrants from Israel (85.0%, a difference of 0.0%), Immigrants from Western Africa (85.0%, a difference of 0.010%), Immigrants from Spain (85.0%, a difference of 0.010%), and Immigrants from Chile (85.0%, a difference of 0.010%).
| Demographics | Rating | Rank | In Labor Force | Age 30-34 |
| Austrians | 90.9 /100 | #126 | Exceptional 85.0% |
| Slavs | 90.7 /100 | #127 | Exceptional 85.0% |
| Immigrants | Argentina | 90.6 /100 | #128 | Exceptional 85.0% |
| Immigrants | Western Africa | 90.2 /100 | #129 | Exceptional 85.0% |
| Immigrants | Spain | 90.0 /100 | #130 | Exceptional 85.0% |
| Chinese | 89.6 /100 | #131 | Excellent 85.0% |
| Immigrants | Israel | 89.5 /100 | #132 | Excellent 85.0% |
| New Zealanders | 89.5 /100 | #133 | Excellent 85.0% |
| Immigrants | Chile | 89.2 /100 | #134 | Excellent 85.0% |
| Immigrants | Asia | 88.9 /100 | #135 | Excellent 85.0% |
| Jordanians | 88.6 /100 | #136 | Excellent 85.0% |
| South Africans | 88.0 /100 | #137 | Excellent 85.0% |
| Sri Lankans | 87.8 /100 | #138 | Excellent 85.0% |
| Bhutanese | 87.5 /100 | #139 | Excellent 85.0% |
| Immigrants | Vietnam | 86.5 /100 | #140 | Excellent 85.0% |
Demographics Similar to Immigrants from Uzbekistan by In Labor Force | Age 30-34
In terms of in labor force | age 30-34, the demographic groups most similar to Immigrants from Uzbekistan are Israeli (84.7%, a difference of 0.010%), Finnish (84.7%, a difference of 0.010%), Immigrants from South America (84.7%, a difference of 0.010%), South American Indian (84.7%, a difference of 0.020%), and Immigrants from Burma/Myanmar (84.7%, a difference of 0.020%).
| Demographics | Rating | Rank | In Labor Force | Age 30-34 |
| South American Indians | 52.1 /100 | #169 | Average 84.7% |
| Immigrants | Burma/Myanmar | 52.0 /100 | #170 | Average 84.7% |
| Irish | 52.0 /100 | #171 | Average 84.7% |
| Immigrants | England | 51.7 /100 | #172 | Average 84.7% |
| Israelis | 51.1 /100 | #173 | Average 84.7% |
| Finns | 50.0 /100 | #174 | Average 84.7% |
| Immigrants | South America | 50.0 /100 | #175 | Average 84.7% |
| Immigrants | Uzbekistan | 49.1 /100 | #176 | Average 84.7% |
| Laotians | 46.9 /100 | #177 | Average 84.7% |
| Okinawans | 44.1 /100 | #178 | Average 84.6% |
| Immigrants | Nigeria | 42.5 /100 | #179 | Average 84.6% |
| Immigrants | Netherlands | 42.1 /100 | #180 | Average 84.6% |
| Moroccans | 40.3 /100 | #181 | Average 84.6% |
| Barbadians | 36.7 /100 | #182 | Fair 84.6% |
| Immigrants | Canada | 35.0 /100 | #183 | Fair 84.6% |