New Zealander vs Ugandan In Labor Force | Age 30-34
COMPARE
New Zealander
Ugandan
In Labor Force | Age 30-34
In Labor Force | Age 30-34 Comparison
New Zealanders
Ugandans
85.0%
IN LABOR FORCE | AGE 30-34
89.5/ 100
METRIC RATING
133rd/ 347
METRIC RANK
85.8%
IN LABOR FORCE | AGE 30-34
99.9/ 100
METRIC RATING
34th/ 347
METRIC RANK
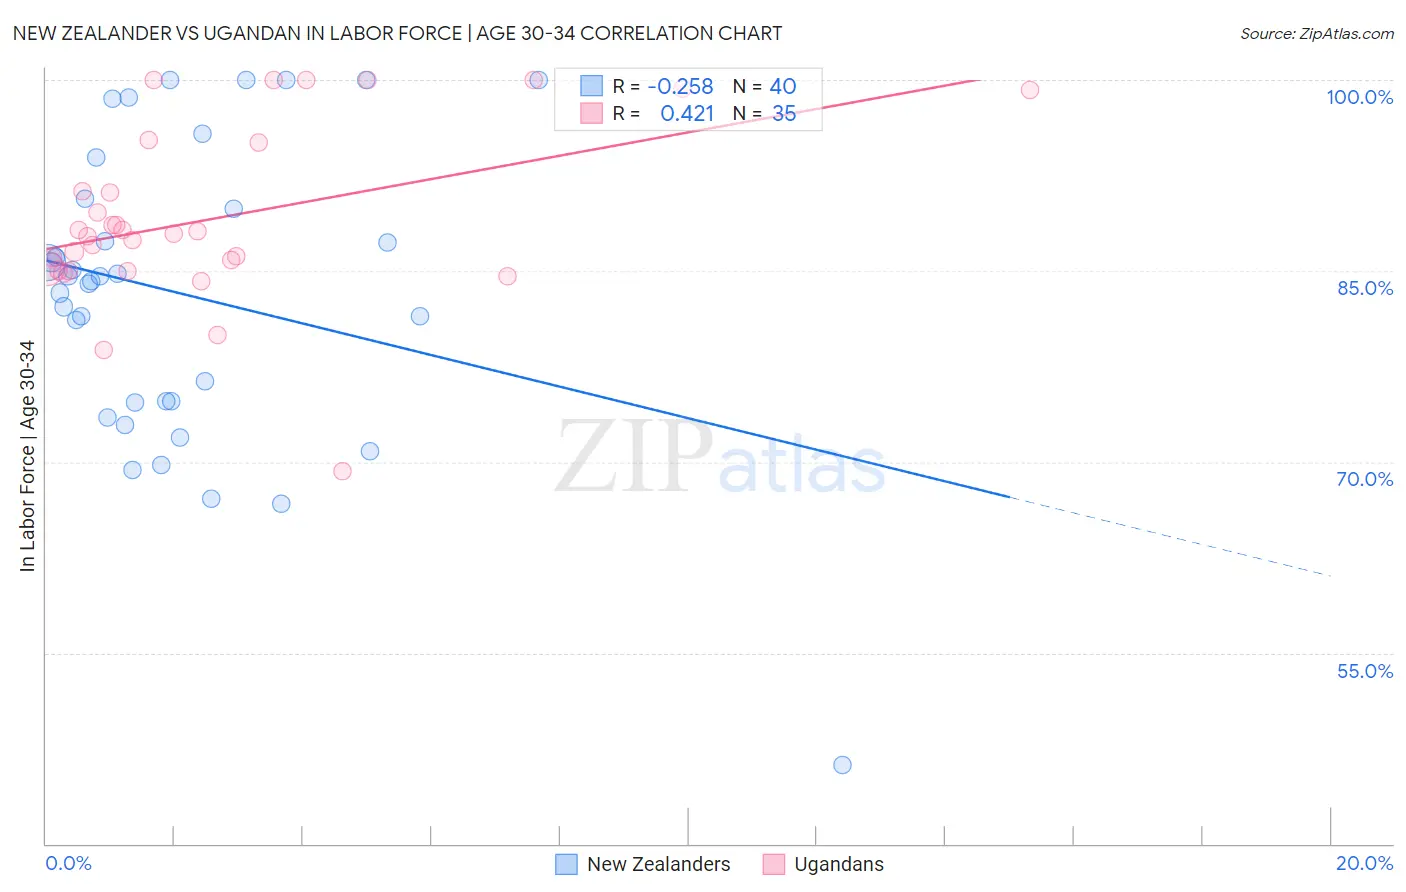
New Zealander vs Ugandan In Labor Force | Age 30-34 Correlation Chart
The statistical analysis conducted on geographies consisting of 106,910,408 people shows a weak negative correlation between the proportion of New Zealanders and labor force participation rate among population between the ages 30 and 34 in the United States with a correlation coefficient (R) of -0.258 and weighted average of 85.0%. Similarly, the statistical analysis conducted on geographies consisting of 93,994,980 people shows a moderate positive correlation between the proportion of Ugandans and labor force participation rate among population between the ages 30 and 34 in the United States with a correlation coefficient (R) of 0.421 and weighted average of 85.8%, a difference of 0.89%.
In Labor Force | Age 30-34 Correlation Summary
| Measurement | New Zealander | Ugandan |
| Minimum | 46.2% | 69.3% |
| Maximum | 100.0% | 100.0% |
| Range | 53.8% | 30.7% |
| Mean | 83.1% | 89.1% |
| Median | 84.4% | 87.9% |
| Interquartile 25% (IQ1) | 74.7% | 85.0% |
| Interquartile 75% (IQ3) | 90.3% | 95.1% |
| Interquartile Range (IQR) | 15.6% | 10.1% |
| Standard Deviation (Sample) | 11.7% | 6.9% |
| Standard Deviation (Population) | 11.6% | 6.8% |
Similar Demographics by In Labor Force | Age 30-34
Demographics Similar to New Zealanders by In Labor Force | Age 30-34
In terms of in labor force | age 30-34, the demographic groups most similar to New Zealanders are Chinese (85.0%, a difference of 0.0%), Immigrants from Israel (85.0%, a difference of 0.0%), Immigrants from Western Africa (85.0%, a difference of 0.010%), Immigrants from Spain (85.0%, a difference of 0.010%), and Immigrants from Chile (85.0%, a difference of 0.010%).
| Demographics | Rating | Rank | In Labor Force | Age 30-34 |
| Austrians | 90.9 /100 | #126 | Exceptional 85.0% |
| Slavs | 90.7 /100 | #127 | Exceptional 85.0% |
| Immigrants | Argentina | 90.6 /100 | #128 | Exceptional 85.0% |
| Immigrants | Western Africa | 90.2 /100 | #129 | Exceptional 85.0% |
| Immigrants | Spain | 90.0 /100 | #130 | Exceptional 85.0% |
| Chinese | 89.6 /100 | #131 | Excellent 85.0% |
| Immigrants | Israel | 89.5 /100 | #132 | Excellent 85.0% |
| New Zealanders | 89.5 /100 | #133 | Excellent 85.0% |
| Immigrants | Chile | 89.2 /100 | #134 | Excellent 85.0% |
| Immigrants | Asia | 88.9 /100 | #135 | Excellent 85.0% |
| Jordanians | 88.6 /100 | #136 | Excellent 85.0% |
| South Africans | 88.0 /100 | #137 | Excellent 85.0% |
| Sri Lankans | 87.8 /100 | #138 | Excellent 85.0% |
| Bhutanese | 87.5 /100 | #139 | Excellent 85.0% |
| Immigrants | Vietnam | 86.5 /100 | #140 | Excellent 85.0% |
Demographics Similar to Ugandans by In Labor Force | Age 30-34
In terms of in labor force | age 30-34, the demographic groups most similar to Ugandans are Immigrants from Bosnia and Herzegovina (85.8%, a difference of 0.0%), Serbian (85.8%, a difference of 0.0%), Albanian (85.7%, a difference of 0.010%), Norwegian (85.7%, a difference of 0.020%), and Immigrants from Greece (85.7%, a difference of 0.020%).
| Demographics | Rating | Rank | In Labor Force | Age 30-34 |
| Immigrants | Liberia | 100.0 /100 | #27 | Exceptional 85.9% |
| Immigrants | Latvia | 100.0 /100 | #28 | Exceptional 85.9% |
| Tsimshian | 100.0 /100 | #29 | Exceptional 85.8% |
| Immigrants | Hong Kong | 100.0 /100 | #30 | Exceptional 85.8% |
| Paraguayans | 99.9 /100 | #31 | Exceptional 85.8% |
| Cypriots | 99.9 /100 | #32 | Exceptional 85.8% |
| Immigrants | Bosnia and Herzegovina | 99.9 /100 | #33 | Exceptional 85.8% |
| Ugandans | 99.9 /100 | #34 | Exceptional 85.8% |
| Serbians | 99.9 /100 | #35 | Exceptional 85.8% |
| Albanians | 99.9 /100 | #36 | Exceptional 85.7% |
| Norwegians | 99.9 /100 | #37 | Exceptional 85.7% |
| Immigrants | Greece | 99.9 /100 | #38 | Exceptional 85.7% |
| Eastern Europeans | 99.9 /100 | #39 | Exceptional 85.7% |
| Turks | 99.9 /100 | #40 | Exceptional 85.7% |
| Immigrants | Italy | 99.9 /100 | #41 | Exceptional 85.7% |