Canadian vs Liberian In Labor Force | Age 25-29
COMPARE
Canadian
Liberian
In Labor Force | Age 25-29
In Labor Force | Age 25-29 Comparison
Canadians
Liberians
84.7%
IN LABOR FORCE | AGE 25-29
58.5/ 100
METRIC RATING
161st/ 347
METRIC RANK
86.1%
IN LABOR FORCE | AGE 25-29
100.0/ 100
METRIC RATING
10th/ 347
METRIC RANK
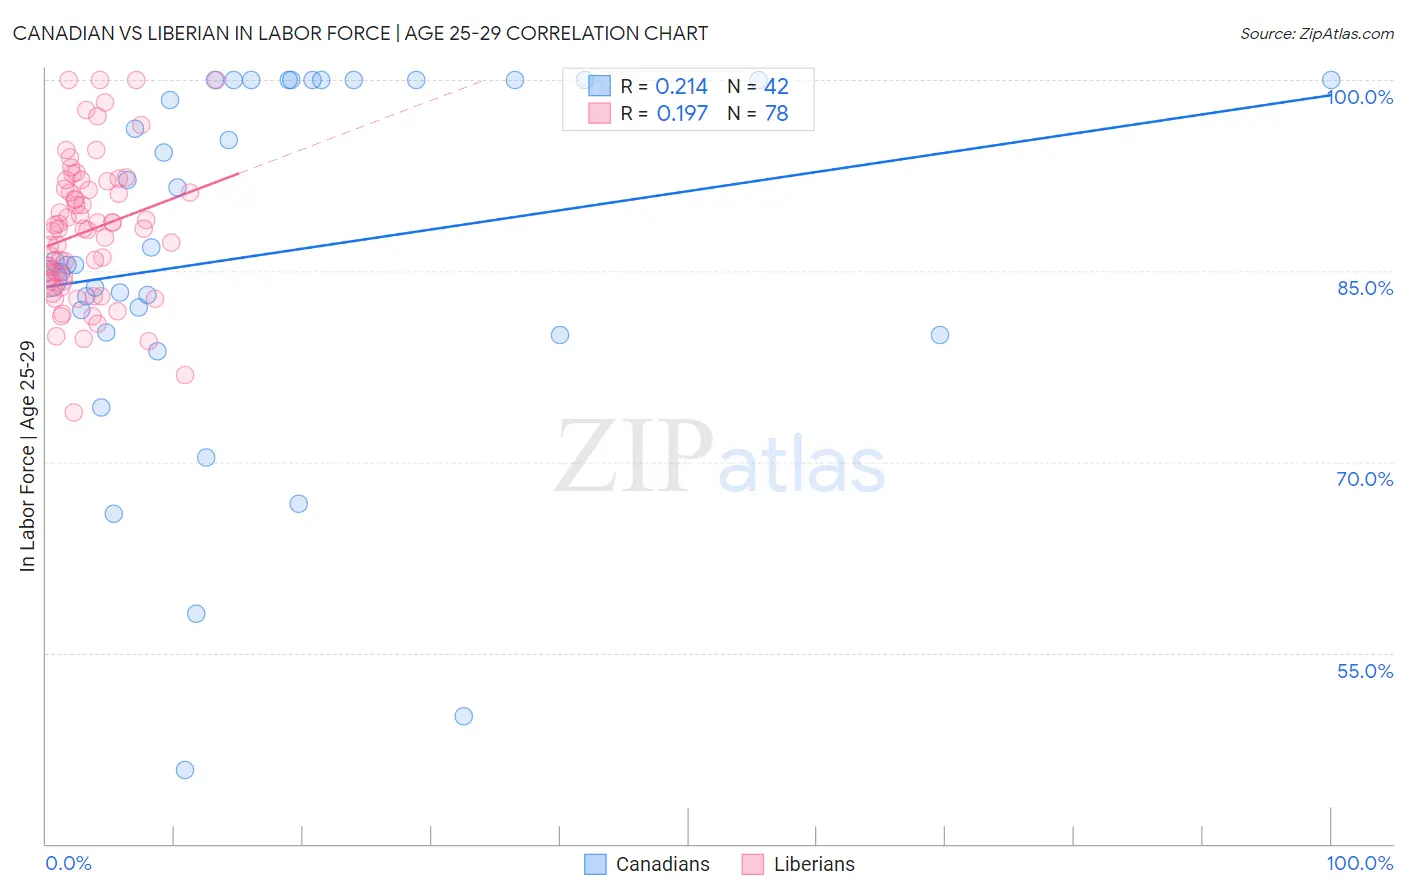
Canadian vs Liberian In Labor Force | Age 25-29 Correlation Chart
The statistical analysis conducted on geographies consisting of 437,288,132 people shows a weak positive correlation between the proportion of Canadians and labor force participation rate among population between the ages 25 and 29 in the United States with a correlation coefficient (R) of 0.214 and weighted average of 84.7%. Similarly, the statistical analysis conducted on geographies consisting of 118,077,550 people shows a poor positive correlation between the proportion of Liberians and labor force participation rate among population between the ages 25 and 29 in the United States with a correlation coefficient (R) of 0.197 and weighted average of 86.1%, a difference of 1.7%.
In Labor Force | Age 25-29 Correlation Summary
| Measurement | Canadian | Liberian |
| Minimum | 45.8% | 73.9% |
| Maximum | 100.0% | 100.0% |
| Range | 54.2% | 26.1% |
| Mean | 86.4% | 88.1% |
| Median | 85.6% | 88.3% |
| Interquartile 25% (IQ1) | 80.2% | 84.2% |
| Interquartile 75% (IQ3) | 100.0% | 91.5% |
| Interquartile Range (IQR) | 19.8% | 7.3% |
| Standard Deviation (Sample) | 14.1% | 5.5% |
| Standard Deviation (Population) | 13.9% | 5.5% |
Similar Demographics by In Labor Force | Age 25-29
Demographics Similar to Canadians by In Labor Force | Age 25-29
In terms of in labor force | age 25-29, the demographic groups most similar to Canadians are Immigrants from Peru (84.7%, a difference of 0.0%), Immigrants from Colombia (84.7%, a difference of 0.0%), Argentinean (84.7%, a difference of 0.0%), British (84.7%, a difference of 0.010%), and Immigrants from Ghana (84.7%, a difference of 0.010%).
| Demographics | Rating | Rank | In Labor Force | Age 25-29 |
| Immigrants | Sri Lanka | 61.7 /100 | #154 | Good 84.7% |
| Indians (Asian) | 61.6 /100 | #155 | Good 84.7% |
| French | 61.0 /100 | #156 | Good 84.7% |
| British | 60.4 /100 | #157 | Good 84.7% |
| Immigrants | Ghana | 60.2 /100 | #158 | Good 84.7% |
| Immigrants | Western Africa | 60.1 /100 | #159 | Good 84.7% |
| Immigrants | Peru | 58.6 /100 | #160 | Average 84.7% |
| Canadians | 58.5 /100 | #161 | Average 84.7% |
| Immigrants | Colombia | 58.3 /100 | #162 | Average 84.7% |
| Argentineans | 57.9 /100 | #163 | Average 84.7% |
| Ghanaians | 57.6 /100 | #164 | Average 84.7% |
| Immigrants | Burma/Myanmar | 57.4 /100 | #165 | Average 84.7% |
| Immigrants | Spain | 56.9 /100 | #166 | Average 84.7% |
| Indonesians | 56.5 /100 | #167 | Average 84.7% |
| South Americans | 54.9 /100 | #168 | Average 84.7% |
Demographics Similar to Liberians by In Labor Force | Age 25-29
In terms of in labor force | age 25-29, the demographic groups most similar to Liberians are Immigrants from Ethiopia (86.1%, a difference of 0.0%), Immigrants from Lithuania (86.1%, a difference of 0.010%), Norwegian (86.1%, a difference of 0.030%), Ethiopian (86.2%, a difference of 0.050%), and Latvian (86.1%, a difference of 0.060%).
| Demographics | Rating | Rank | In Labor Force | Age 25-29 |
| Somalis | 100.0 /100 | #3 | Exceptional 87.1% |
| Carpatho Rusyns | 100.0 /100 | #4 | Exceptional 87.0% |
| Luxembourgers | 100.0 /100 | #5 | Exceptional 86.9% |
| Slovenes | 100.0 /100 | #6 | Exceptional 86.4% |
| Immigrants | Bosnia and Herzegovina | 100.0 /100 | #7 | Exceptional 86.3% |
| Immigrants | Cabo Verde | 100.0 /100 | #8 | Exceptional 86.2% |
| Ethiopians | 100.0 /100 | #9 | Exceptional 86.2% |
| Liberians | 100.0 /100 | #10 | Exceptional 86.1% |
| Immigrants | Ethiopia | 100.0 /100 | #11 | Exceptional 86.1% |
| Immigrants | Lithuania | 100.0 /100 | #12 | Exceptional 86.1% |
| Norwegians | 100.0 /100 | #13 | Exceptional 86.1% |
| Latvians | 100.0 /100 | #14 | Exceptional 86.1% |
| Bolivians | 100.0 /100 | #15 | Exceptional 86.1% |
| Immigrants | Bolivia | 100.0 /100 | #16 | Exceptional 86.1% |
| Bermudans | 100.0 /100 | #17 | Exceptional 86.0% |