Macedonian vs Immigrants from Scotland In Labor Force | Age 25-29
COMPARE
Macedonian
Immigrants from Scotland
In Labor Force | Age 25-29
In Labor Force | Age 25-29 Comparison
Macedonians
Immigrants from Scotland
85.7%
IN LABOR FORCE | AGE 25-29
99.9/ 100
METRIC RATING
44th/ 347
METRIC RANK
85.4%
IN LABOR FORCE | AGE 25-29
99.3/ 100
METRIC RATING
66th/ 347
METRIC RANK
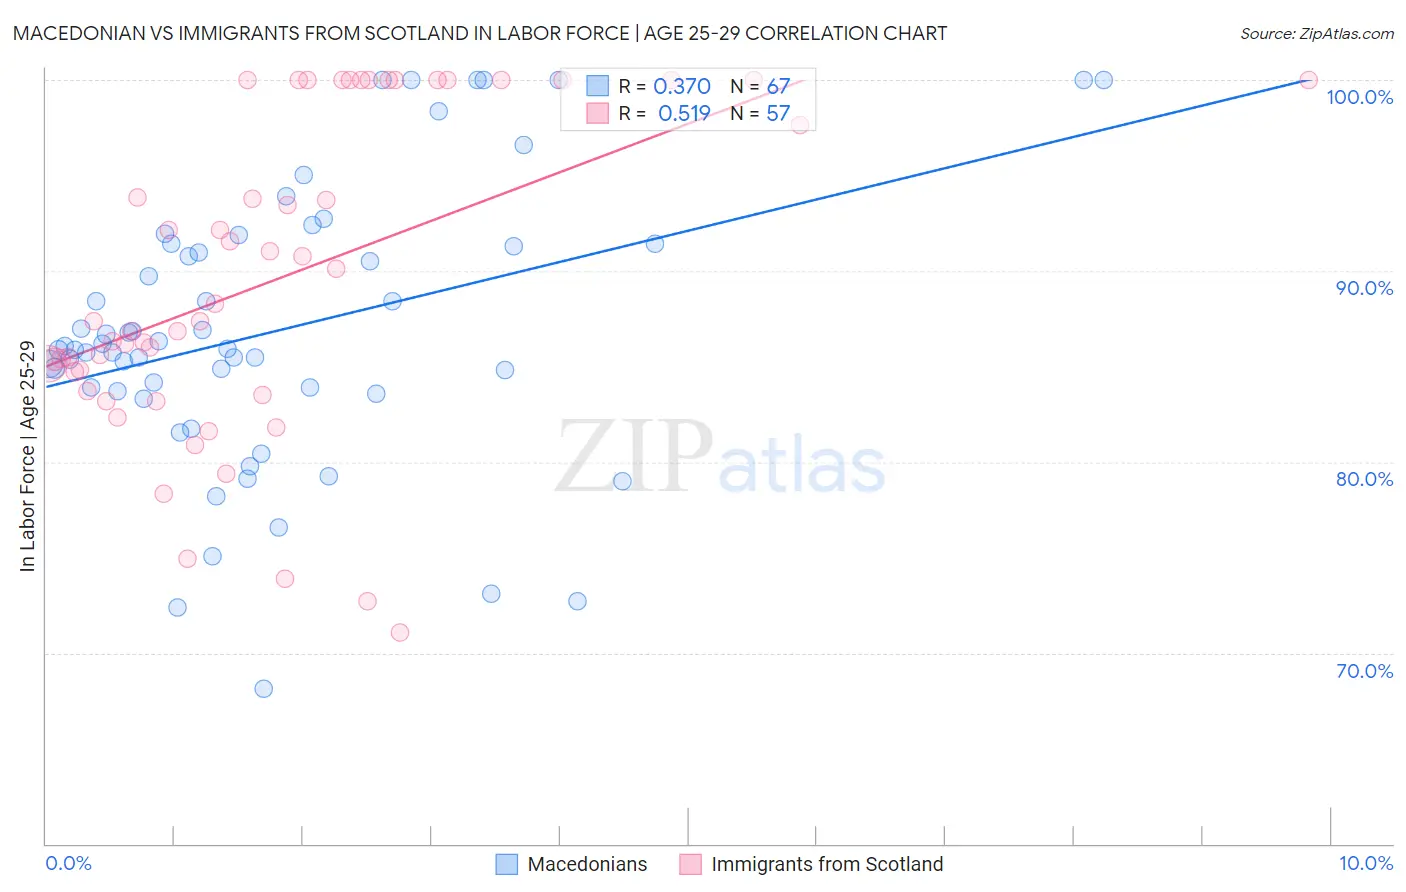
Macedonian vs Immigrants from Scotland In Labor Force | Age 25-29 Correlation Chart
The statistical analysis conducted on geographies consisting of 132,648,005 people shows a mild positive correlation between the proportion of Macedonians and labor force participation rate among population between the ages 25 and 29 in the United States with a correlation coefficient (R) of 0.370 and weighted average of 85.7%. Similarly, the statistical analysis conducted on geographies consisting of 196,358,343 people shows a substantial positive correlation between the proportion of Immigrants from Scotland and labor force participation rate among population between the ages 25 and 29 in the United States with a correlation coefficient (R) of 0.519 and weighted average of 85.4%, a difference of 0.30%.
In Labor Force | Age 25-29 Correlation Summary
| Measurement | Macedonian | Immigrants from Scotland |
| Minimum | 68.1% | 71.0% |
| Maximum | 100.0% | 100.0% |
| Range | 31.9% | 29.0% |
| Mean | 86.9% | 89.6% |
| Median | 85.9% | 87.4% |
| Interquartile 25% (IQ1) | 83.7% | 84.2% |
| Interquartile 75% (IQ3) | 91.4% | 100.0% |
| Interquartile Range (IQR) | 7.7% | 15.8% |
| Standard Deviation (Sample) | 7.3% | 8.3% |
| Standard Deviation (Population) | 7.2% | 8.2% |
Similar Demographics by In Labor Force | Age 25-29
Demographics Similar to Macedonians by In Labor Force | Age 25-29
In terms of in labor force | age 25-29, the demographic groups most similar to Macedonians are Immigrants from Sierra Leone (85.7%, a difference of 0.0%), Immigrants from India (85.7%, a difference of 0.010%), Immigrants from Eritrea (85.7%, a difference of 0.020%), Czech (85.6%, a difference of 0.030%), and Immigrants from Greece (85.7%, a difference of 0.060%).
| Demographics | Rating | Rank | In Labor Force | Age 25-29 |
| Poles | 99.9 /100 | #37 | Exceptional 85.8% |
| Sierra Leoneans | 99.9 /100 | #38 | Exceptional 85.8% |
| Croatians | 99.9 /100 | #39 | Exceptional 85.8% |
| Immigrants | Albania | 99.9 /100 | #40 | Exceptional 85.7% |
| Immigrants | Greece | 99.9 /100 | #41 | Exceptional 85.7% |
| Immigrants | Eritrea | 99.9 /100 | #42 | Exceptional 85.7% |
| Immigrants | India | 99.9 /100 | #43 | Exceptional 85.7% |
| Macedonians | 99.9 /100 | #44 | Exceptional 85.7% |
| Immigrants | Sierra Leone | 99.9 /100 | #45 | Exceptional 85.7% |
| Czechs | 99.8 /100 | #46 | Exceptional 85.6% |
| Turks | 99.8 /100 | #47 | Exceptional 85.6% |
| Italians | 99.8 /100 | #48 | Exceptional 85.6% |
| Swedes | 99.8 /100 | #49 | Exceptional 85.6% |
| Yugoslavians | 99.8 /100 | #50 | Exceptional 85.6% |
| Immigrants | Latvia | 99.8 /100 | #51 | Exceptional 85.6% |
Demographics Similar to Immigrants from Scotland by In Labor Force | Age 25-29
In terms of in labor force | age 25-29, the demographic groups most similar to Immigrants from Scotland are Immigrants from Italy (85.4%, a difference of 0.010%), Immigrants from Czechoslovakia (85.4%, a difference of 0.010%), Immigrants from Turkey (85.4%, a difference of 0.010%), Immigrants from Cameroon (85.4%, a difference of 0.020%), and Immigrants from Kenya (85.4%, a difference of 0.030%).
| Demographics | Rating | Rank | In Labor Force | Age 25-29 |
| Immigrants | Morocco | 99.5 /100 | #59 | Exceptional 85.5% |
| Thais | 99.5 /100 | #60 | Exceptional 85.5% |
| Serbians | 99.5 /100 | #61 | Exceptional 85.5% |
| Taiwanese | 99.4 /100 | #62 | Exceptional 85.4% |
| Immigrants | Kenya | 99.4 /100 | #63 | Exceptional 85.4% |
| Immigrants | Italy | 99.3 /100 | #64 | Exceptional 85.4% |
| Immigrants | Czechoslovakia | 99.3 /100 | #65 | Exceptional 85.4% |
| Immigrants | Scotland | 99.3 /100 | #66 | Exceptional 85.4% |
| Immigrants | Turkey | 99.2 /100 | #67 | Exceptional 85.4% |
| Immigrants | Cameroon | 99.2 /100 | #68 | Exceptional 85.4% |
| Menominee | 99.1 /100 | #69 | Exceptional 85.4% |
| Immigrants | Sweden | 99.1 /100 | #70 | Exceptional 85.4% |
| Kenyans | 99.0 /100 | #71 | Exceptional 85.4% |
| Immigrants | Australia | 98.9 /100 | #72 | Exceptional 85.3% |
| Russians | 98.8 /100 | #73 | Exceptional 85.3% |