Immigrants from Congo vs Immigrants from Bangladesh In Labor Force | Age 20-24
COMPARE
Immigrants from Congo
Immigrants from Bangladesh
In Labor Force | Age 20-24
In Labor Force | Age 20-24 Comparison
Immigrants from Congo
Immigrants from Bangladesh
77.4%
IN LABOR FORCE | AGE 20-24
100.0/ 100
METRIC RATING
41st/ 347
METRIC RANK
70.6%
IN LABOR FORCE | AGE 20-24
0.0/ 100
METRIC RATING
331st/ 347
METRIC RANK
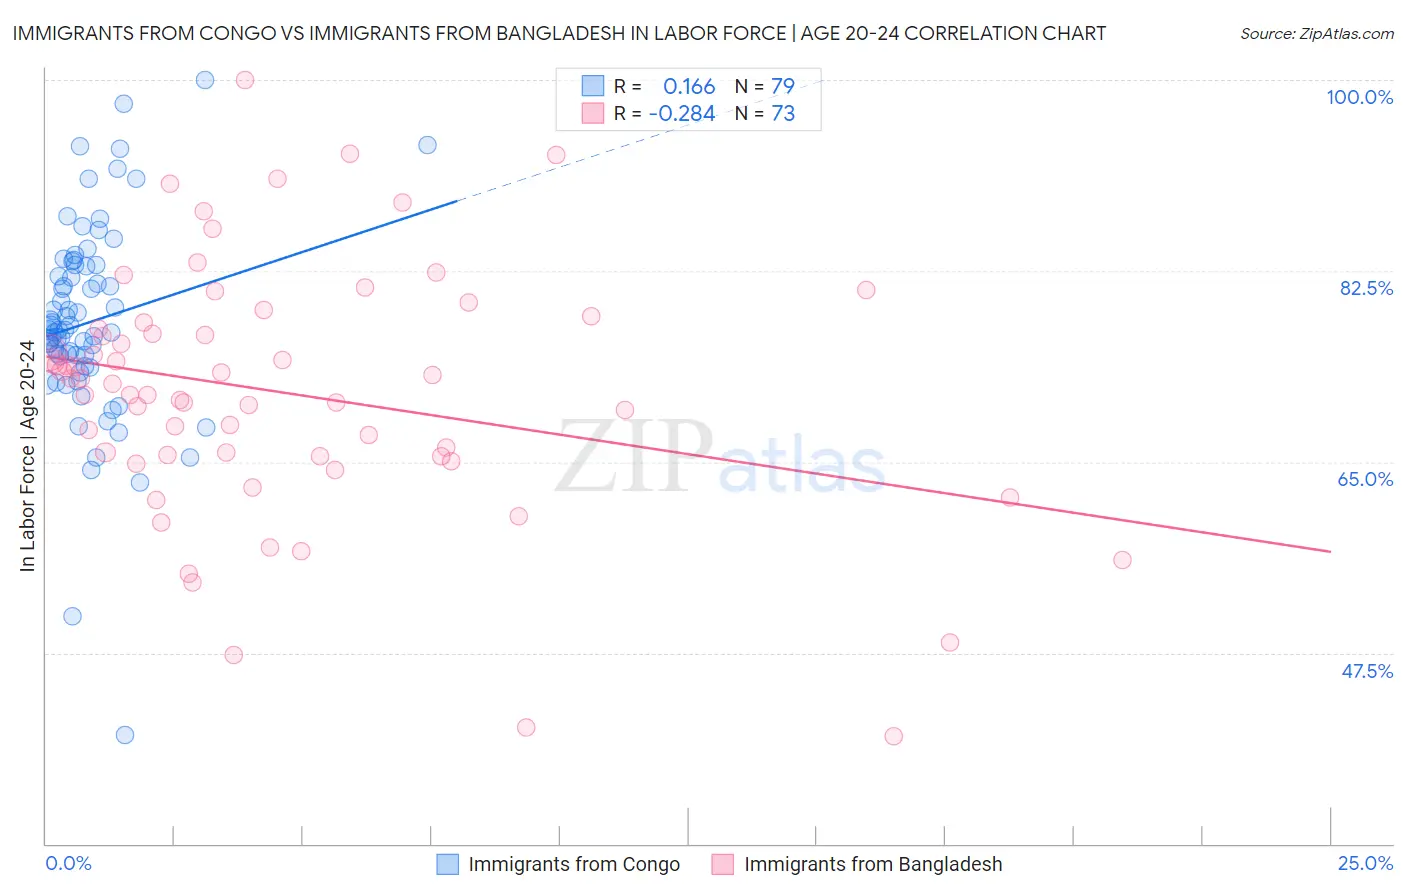
Immigrants from Congo vs Immigrants from Bangladesh In Labor Force | Age 20-24 Correlation Chart
The statistical analysis conducted on geographies consisting of 92,127,534 people shows a poor positive correlation between the proportion of Immigrants from Congo and labor force participation rate among population between the ages 20 and 24 in the United States with a correlation coefficient (R) of 0.166 and weighted average of 77.4%. Similarly, the statistical analysis conducted on geographies consisting of 203,671,040 people shows a weak negative correlation between the proportion of Immigrants from Bangladesh and labor force participation rate among population between the ages 20 and 24 in the United States with a correlation coefficient (R) of -0.284 and weighted average of 70.6%, a difference of 9.6%.
In Labor Force | Age 20-24 Correlation Summary
| Measurement | Immigrants from Congo | Immigrants from Bangladesh |
| Minimum | 40.0% | 39.8% |
| Maximum | 100.0% | 100.0% |
| Range | 60.0% | 60.2% |
| Mean | 77.8% | 71.3% |
| Median | 77.1% | 72.1% |
| Interquartile 25% (IQ1) | 73.8% | 65.5% |
| Interquartile 75% (IQ3) | 83.0% | 77.5% |
| Interquartile Range (IQR) | 9.2% | 12.0% |
| Standard Deviation (Sample) | 9.2% | 11.5% |
| Standard Deviation (Population) | 9.2% | 11.5% |
Similar Demographics by In Labor Force | Age 20-24
Demographics Similar to Immigrants from Congo by In Labor Force | Age 20-24
In terms of in labor force | age 20-24, the demographic groups most similar to Immigrants from Congo are Scottish (77.4%, a difference of 0.010%), French (77.4%, a difference of 0.010%), Immigrants from Laos (77.4%, a difference of 0.020%), Fijian (77.4%, a difference of 0.030%), and Irish (77.4%, a difference of 0.040%).
| Demographics | Rating | Rank | In Labor Force | Age 20-24 |
| German Russians | 100.0 /100 | #34 | Exceptional 77.5% |
| Immigrants | Eastern Africa | 100.0 /100 | #35 | Exceptional 77.5% |
| Welsh | 100.0 /100 | #36 | Exceptional 77.5% |
| Czechoslovakians | 100.0 /100 | #37 | Exceptional 77.5% |
| Marshallese | 100.0 /100 | #38 | Exceptional 77.4% |
| Irish | 100.0 /100 | #39 | Exceptional 77.4% |
| Scottish | 100.0 /100 | #40 | Exceptional 77.4% |
| Immigrants | Congo | 100.0 /100 | #41 | Exceptional 77.4% |
| French | 100.0 /100 | #42 | Exceptional 77.4% |
| Immigrants | Laos | 100.0 /100 | #43 | Exceptional 77.4% |
| Fijians | 100.0 /100 | #44 | Exceptional 77.4% |
| Native Hawaiians | 100.0 /100 | #45 | Exceptional 77.4% |
| Samoans | 100.0 /100 | #46 | Exceptional 77.4% |
| Ethiopians | 100.0 /100 | #47 | Exceptional 77.3% |
| Serbians | 100.0 /100 | #48 | Exceptional 77.3% |
Demographics Similar to Immigrants from Bangladesh by In Labor Force | Age 20-24
In terms of in labor force | age 20-24, the demographic groups most similar to Immigrants from Bangladesh are Vietnamese (70.6%, a difference of 0.020%), Immigrants from Uzbekistan (70.4%, a difference of 0.30%), Yup'ik (70.9%, a difference of 0.37%), Yuman (70.3%, a difference of 0.53%), and Immigrants from China (71.1%, a difference of 0.61%).
| Demographics | Rating | Rank | In Labor Force | Age 20-24 |
| Immigrants | Dominican Republic | 0.0 /100 | #324 | Tragic 71.2% |
| Barbadians | 0.0 /100 | #325 | Tragic 71.1% |
| Dominicans | 0.0 /100 | #326 | Tragic 71.1% |
| Immigrants | Trinidad and Tobago | 0.0 /100 | #327 | Tragic 71.1% |
| Immigrants | China | 0.0 /100 | #328 | Tragic 71.1% |
| Yup'ik | 0.0 /100 | #329 | Tragic 70.9% |
| Vietnamese | 0.0 /100 | #330 | Tragic 70.6% |
| Immigrants | Bangladesh | 0.0 /100 | #331 | Tragic 70.6% |
| Immigrants | Uzbekistan | 0.0 /100 | #332 | Tragic 70.4% |
| Yuman | 0.0 /100 | #333 | Tragic 70.3% |
| British West Indians | 0.0 /100 | #334 | Tragic 70.0% |
| Immigrants | Barbados | 0.0 /100 | #335 | Tragic 69.7% |
| Immigrants | Guyana | 0.0 /100 | #336 | Tragic 69.3% |
| Guyanese | 0.0 /100 | #337 | Tragic 69.2% |
| Pima | 0.0 /100 | #338 | Tragic 69.0% |