Immigrants from Croatia vs Laotian In Labor Force | Age 25-29
COMPARE
Immigrants from Croatia
Laotian
In Labor Force | Age 25-29
In Labor Force | Age 25-29 Comparison
Immigrants from Croatia
Laotians
85.2%
IN LABOR FORCE | AGE 25-29
96.4/ 100
METRIC RATING
88th/ 347
METRIC RANK
84.4%
IN LABOR FORCE | AGE 25-29
16.6/ 100
METRIC RATING
201st/ 347
METRIC RANK
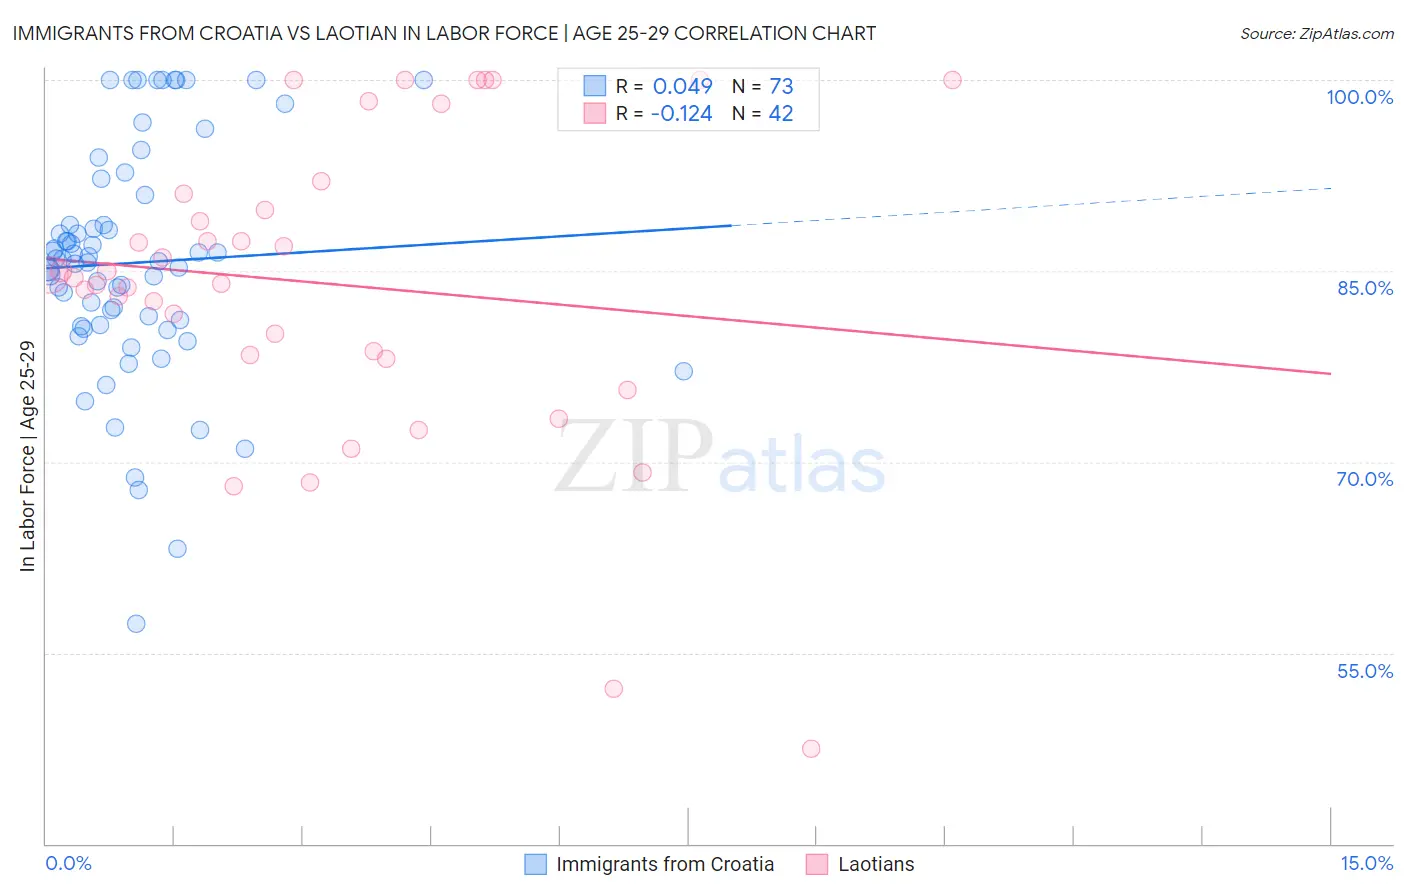
Immigrants from Croatia vs Laotian In Labor Force | Age 25-29 Correlation Chart
The statistical analysis conducted on geographies consisting of 132,545,183 people shows no correlation between the proportion of Immigrants from Croatia and labor force participation rate among population between the ages 25 and 29 in the United States with a correlation coefficient (R) of 0.049 and weighted average of 85.2%. Similarly, the statistical analysis conducted on geographies consisting of 224,828,229 people shows a poor negative correlation between the proportion of Laotians and labor force participation rate among population between the ages 25 and 29 in the United States with a correlation coefficient (R) of -0.124 and weighted average of 84.4%, a difference of 0.91%.
In Labor Force | Age 25-29 Correlation Summary
| Measurement | Immigrants from Croatia | Laotian |
| Minimum | 57.3% | 47.5% |
| Maximum | 100.0% | 100.0% |
| Range | 42.7% | 52.5% |
| Mean | 85.6% | 84.0% |
| Median | 85.8% | 84.6% |
| Interquartile 25% (IQ1) | 80.7% | 78.4% |
| Interquartile 75% (IQ3) | 89.8% | 91.0% |
| Interquartile Range (IQR) | 9.1% | 12.7% |
| Standard Deviation (Sample) | 9.1% | 12.2% |
| Standard Deviation (Population) | 9.0% | 12.0% |
Similar Demographics by In Labor Force | Age 25-29
Demographics Similar to Immigrants from Croatia by In Labor Force | Age 25-29
In terms of in labor force | age 25-29, the demographic groups most similar to Immigrants from Croatia are French Canadian (85.2%, a difference of 0.0%), Ukrainian (85.2%, a difference of 0.010%), Immigrants from France (85.2%, a difference of 0.010%), Immigrants from Europe (85.2%, a difference of 0.020%), and Immigrants from Eastern Europe (85.2%, a difference of 0.020%).
| Demographics | Rating | Rank | In Labor Force | Age 25-29 |
| Immigrants | Northern Europe | 97.2 /100 | #81 | Exceptional 85.2% |
| Okinawans | 97.0 /100 | #82 | Exceptional 85.2% |
| Immigrants | Europe | 96.8 /100 | #83 | Exceptional 85.2% |
| Immigrants | Eastern Europe | 96.8 /100 | #84 | Exceptional 85.2% |
| Immigrants | Africa | 96.7 /100 | #85 | Exceptional 85.2% |
| Ukrainians | 96.7 /100 | #86 | Exceptional 85.2% |
| French Canadians | 96.5 /100 | #87 | Exceptional 85.2% |
| Immigrants | Croatia | 96.4 /100 | #88 | Exceptional 85.2% |
| Immigrants | France | 96.3 /100 | #89 | Exceptional 85.2% |
| Burmese | 95.9 /100 | #90 | Exceptional 85.1% |
| Immigrants | Moldova | 95.8 /100 | #91 | Exceptional 85.1% |
| Immigrants | Costa Rica | 95.5 /100 | #92 | Exceptional 85.1% |
| Austrians | 95.3 /100 | #93 | Exceptional 85.1% |
| Immigrants | Korea | 94.8 /100 | #94 | Exceptional 85.1% |
| Immigrants | Netherlands | 94.6 /100 | #95 | Exceptional 85.1% |
Demographics Similar to Laotians by In Labor Force | Age 25-29
In terms of in labor force | age 25-29, the demographic groups most similar to Laotians are Immigrants from Kazakhstan (84.4%, a difference of 0.010%), Afghan (84.4%, a difference of 0.010%), Immigrants from Afghanistan (84.4%, a difference of 0.010%), Immigrants from Germany (84.4%, a difference of 0.020%), and Venezuelan (84.4%, a difference of 0.020%).
| Demographics | Rating | Rank | In Labor Force | Age 25-29 |
| Portuguese | 21.2 /100 | #194 | Fair 84.4% |
| Immigrants | Israel | 20.8 /100 | #195 | Fair 84.4% |
| Immigrants | South Eastern Asia | 19.5 /100 | #196 | Poor 84.4% |
| Tlingit-Haida | 19.3 /100 | #197 | Poor 84.4% |
| Immigrants | Iraq | 19.0 /100 | #198 | Poor 84.4% |
| Immigrants | Germany | 18.3 /100 | #199 | Poor 84.4% |
| Immigrants | Kazakhstan | 17.5 /100 | #200 | Poor 84.4% |
| Laotians | 16.6 /100 | #201 | Poor 84.4% |
| Afghans | 15.9 /100 | #202 | Poor 84.4% |
| Immigrants | Afghanistan | 15.6 /100 | #203 | Poor 84.4% |
| Venezuelans | 15.1 /100 | #204 | Poor 84.4% |
| Ecuadorians | 14.8 /100 | #205 | Poor 84.4% |
| Immigrants | Cambodia | 14.3 /100 | #206 | Poor 84.4% |
| Immigrants | Armenia | 13.3 /100 | #207 | Poor 84.4% |
| Immigrants | Indonesia | 13.2 /100 | #208 | Poor 84.4% |