Spanish American vs Laotian In Labor Force | Age 25-29
COMPARE
Spanish American
Laotian
In Labor Force | Age 25-29
In Labor Force | Age 25-29 Comparison
Spanish Americans
Laotians
83.4%
IN LABOR FORCE | AGE 25-29
0.0/ 100
METRIC RATING
267th/ 347
METRIC RANK
84.4%
IN LABOR FORCE | AGE 25-29
16.6/ 100
METRIC RATING
201st/ 347
METRIC RANK
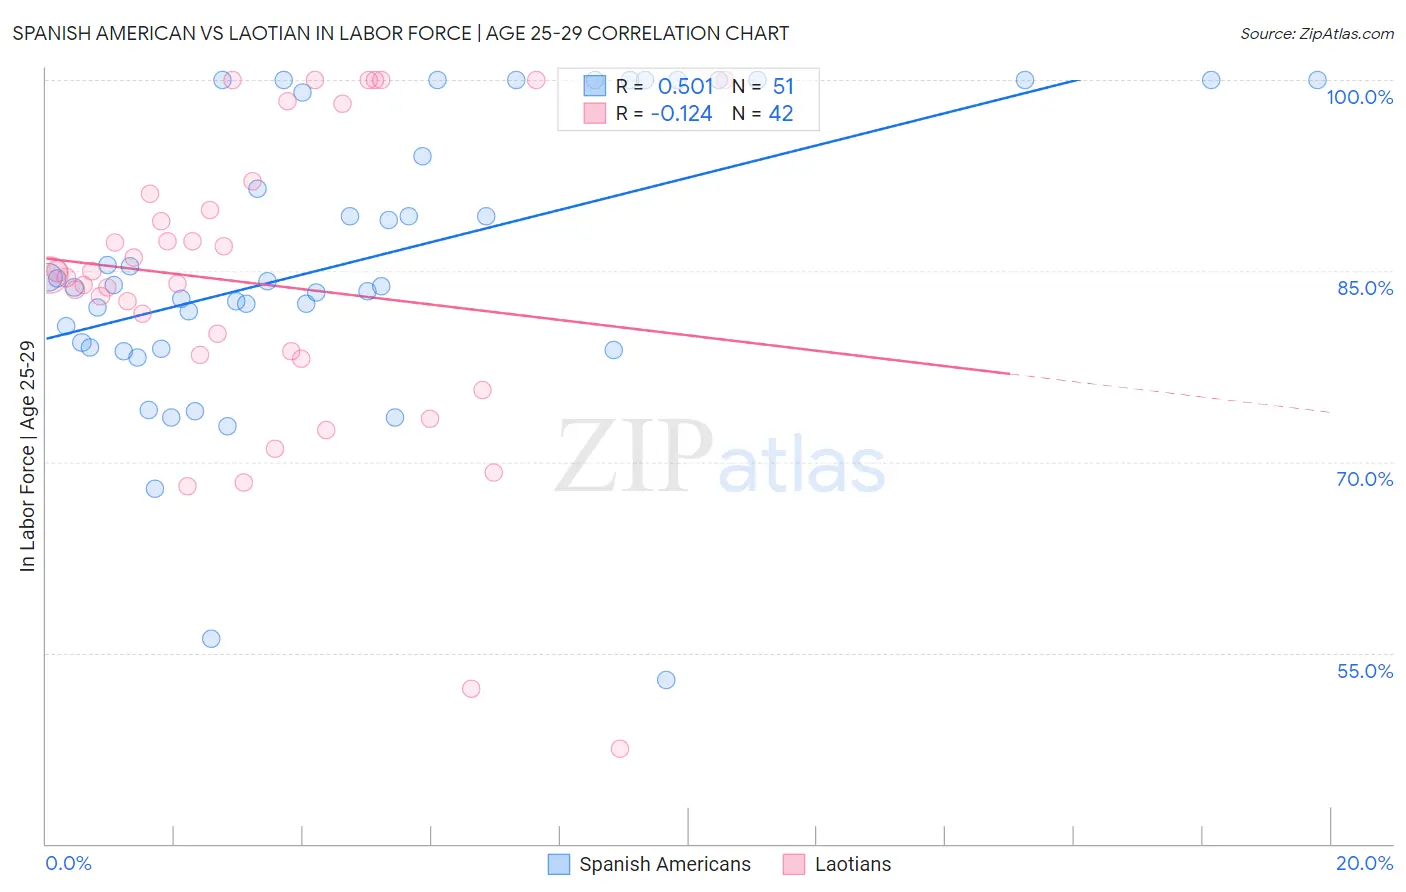
Spanish American vs Laotian In Labor Force | Age 25-29 Correlation Chart
The statistical analysis conducted on geographies consisting of 103,156,103 people shows a substantial positive correlation between the proportion of Spanish Americans and labor force participation rate among population between the ages 25 and 29 in the United States with a correlation coefficient (R) of 0.501 and weighted average of 83.4%. Similarly, the statistical analysis conducted on geographies consisting of 224,828,229 people shows a poor negative correlation between the proportion of Laotians and labor force participation rate among population between the ages 25 and 29 in the United States with a correlation coefficient (R) of -0.124 and weighted average of 84.4%, a difference of 1.2%.
In Labor Force | Age 25-29 Correlation Summary
| Measurement | Spanish American | Laotian |
| Minimum | 52.9% | 47.5% |
| Maximum | 100.0% | 100.0% |
| Range | 47.1% | 52.5% |
| Mean | 85.8% | 84.0% |
| Median | 83.9% | 84.6% |
| Interquartile 25% (IQ1) | 79.0% | 78.4% |
| Interquartile 75% (IQ3) | 100.0% | 91.0% |
| Interquartile Range (IQR) | 21.0% | 12.7% |
| Standard Deviation (Sample) | 11.3% | 12.2% |
| Standard Deviation (Population) | 11.2% | 12.0% |
Similar Demographics by In Labor Force | Age 25-29
Demographics Similar to Spanish Americans by In Labor Force | Age 25-29
In terms of in labor force | age 25-29, the demographic groups most similar to Spanish Americans are Aleut (83.4%, a difference of 0.010%), Immigrants from Lebanon (83.4%, a difference of 0.010%), Immigrants from Barbados (83.4%, a difference of 0.010%), Basque (83.4%, a difference of 0.020%), and Puget Sound Salish (83.5%, a difference of 0.050%).
| Demographics | Rating | Rank | In Labor Force | Age 25-29 |
| Immigrants | Bahamas | 0.1 /100 | #260 | Tragic 83.6% |
| Pennsylvania Germans | 0.1 /100 | #261 | Tragic 83.6% |
| Immigrants | Fiji | 0.1 /100 | #262 | Tragic 83.6% |
| West Indians | 0.1 /100 | #263 | Tragic 83.5% |
| Puget Sound Salish | 0.1 /100 | #264 | Tragic 83.5% |
| Cubans | 0.1 /100 | #265 | Tragic 83.5% |
| Aleuts | 0.0 /100 | #266 | Tragic 83.4% |
| Spanish Americans | 0.0 /100 | #267 | Tragic 83.4% |
| Immigrants | Lebanon | 0.0 /100 | #268 | Tragic 83.4% |
| Immigrants | Barbados | 0.0 /100 | #269 | Tragic 83.4% |
| Basques | 0.0 /100 | #270 | Tragic 83.4% |
| Hondurans | 0.0 /100 | #271 | Tragic 83.4% |
| Immigrants | Caribbean | 0.0 /100 | #272 | Tragic 83.4% |
| Immigrants | Dominica | 0.0 /100 | #273 | Tragic 83.4% |
| Marshallese | 0.0 /100 | #274 | Tragic 83.3% |
Demographics Similar to Laotians by In Labor Force | Age 25-29
In terms of in labor force | age 25-29, the demographic groups most similar to Laotians are Immigrants from Kazakhstan (84.4%, a difference of 0.010%), Afghan (84.4%, a difference of 0.010%), Immigrants from Afghanistan (84.4%, a difference of 0.010%), Immigrants from Germany (84.4%, a difference of 0.020%), and Venezuelan (84.4%, a difference of 0.020%).
| Demographics | Rating | Rank | In Labor Force | Age 25-29 |
| Portuguese | 21.2 /100 | #194 | Fair 84.4% |
| Immigrants | Israel | 20.8 /100 | #195 | Fair 84.4% |
| Immigrants | South Eastern Asia | 19.5 /100 | #196 | Poor 84.4% |
| Tlingit-Haida | 19.3 /100 | #197 | Poor 84.4% |
| Immigrants | Iraq | 19.0 /100 | #198 | Poor 84.4% |
| Immigrants | Germany | 18.3 /100 | #199 | Poor 84.4% |
| Immigrants | Kazakhstan | 17.5 /100 | #200 | Poor 84.4% |
| Laotians | 16.6 /100 | #201 | Poor 84.4% |
| Afghans | 15.9 /100 | #202 | Poor 84.4% |
| Immigrants | Afghanistan | 15.6 /100 | #203 | Poor 84.4% |
| Venezuelans | 15.1 /100 | #204 | Poor 84.4% |
| Ecuadorians | 14.8 /100 | #205 | Poor 84.4% |
| Immigrants | Cambodia | 14.3 /100 | #206 | Poor 84.4% |
| Immigrants | Armenia | 13.3 /100 | #207 | Poor 84.4% |
| Immigrants | Indonesia | 13.2 /100 | #208 | Poor 84.4% |