Yakama vs Immigrants from Chile In Labor Force | Age 45-54
COMPARE
Yakama
Immigrants from Chile
In Labor Force | Age 45-54
In Labor Force | Age 45-54 Comparison
Yakama
Immigrants from Chile
80.6%
IN LABOR FORCE | AGE 45-54
0.0/ 100
METRIC RATING
294th/ 347
METRIC RANK
83.2%
IN LABOR FORCE | AGE 45-54
91.6/ 100
METRIC RATING
115th/ 347
METRIC RANK
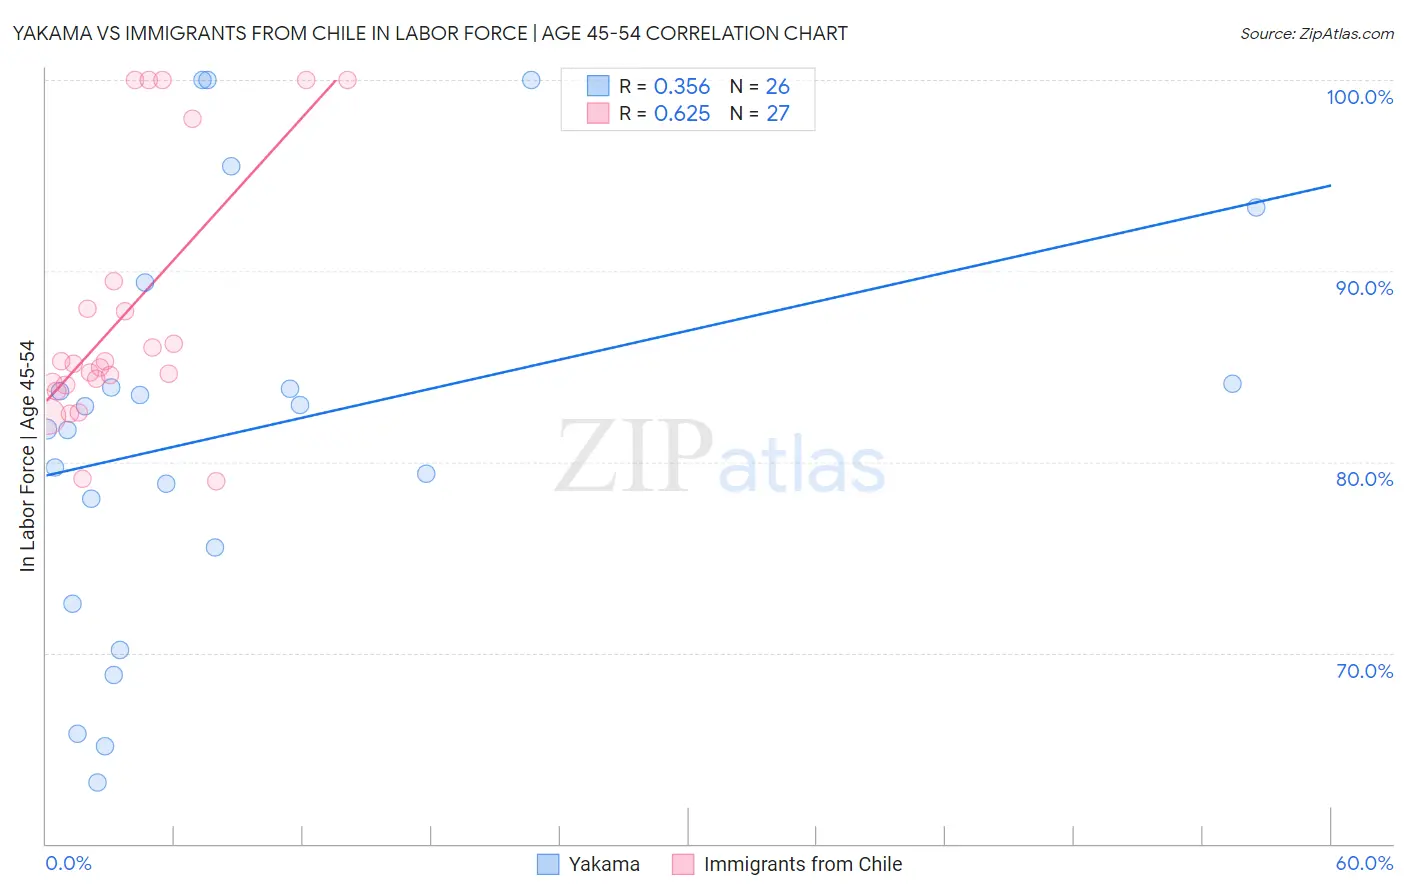
Yakama vs Immigrants from Chile In Labor Force | Age 45-54 Correlation Chart
The statistical analysis conducted on geographies consisting of 19,917,759 people shows a mild positive correlation between the proportion of Yakama and labor force participation rate among population between the ages 45 and 54 in the United States with a correlation coefficient (R) of 0.356 and weighted average of 80.6%. Similarly, the statistical analysis conducted on geographies consisting of 218,594,032 people shows a significant positive correlation between the proportion of Immigrants from Chile and labor force participation rate among population between the ages 45 and 54 in the United States with a correlation coefficient (R) of 0.625 and weighted average of 83.2%, a difference of 3.2%.
In Labor Force | Age 45-54 Correlation Summary
| Measurement | Yakama | Immigrants from Chile |
| Minimum | 63.2% | 79.0% |
| Maximum | 100.0% | 100.0% |
| Range | 36.8% | 21.0% |
| Mean | 81.7% | 87.8% |
| Median | 82.3% | 85.1% |
| Interquartile 25% (IQ1) | 75.5% | 84.1% |
| Interquartile 75% (IQ3) | 84.1% | 89.5% |
| Interquartile Range (IQR) | 8.6% | 5.4% |
| Standard Deviation (Sample) | 10.5% | 6.8% |
| Standard Deviation (Population) | 10.3% | 6.7% |
Similar Demographics by In Labor Force | Age 45-54
Demographics Similar to Yakama by In Labor Force | Age 45-54
In terms of in labor force | age 45-54, the demographic groups most similar to Yakama are Osage (80.6%, a difference of 0.0%), Iroquois (80.6%, a difference of 0.020%), Immigrants from Belize (80.6%, a difference of 0.050%), Nepalese (80.5%, a difference of 0.070%), and African (80.5%, a difference of 0.10%).
| Demographics | Rating | Rank | In Labor Force | Age 45-54 |
| Vietnamese | 0.0 /100 | #287 | Tragic 80.8% |
| Cree | 0.0 /100 | #288 | Tragic 80.8% |
| Immigrants | Bangladesh | 0.0 /100 | #289 | Tragic 80.7% |
| Mexican American Indians | 0.0 /100 | #290 | Tragic 80.7% |
| Immigrants | Belize | 0.0 /100 | #291 | Tragic 80.6% |
| Iroquois | 0.0 /100 | #292 | Tragic 80.6% |
| Osage | 0.0 /100 | #293 | Tragic 80.6% |
| Yakama | 0.0 /100 | #294 | Tragic 80.6% |
| Nepalese | 0.0 /100 | #295 | Tragic 80.5% |
| Africans | 0.0 /100 | #296 | Tragic 80.5% |
| Americans | 0.0 /100 | #297 | Tragic 80.4% |
| Marshallese | 0.0 /100 | #298 | Tragic 80.3% |
| Dominicans | 0.0 /100 | #299 | Tragic 80.3% |
| Fijians | 0.0 /100 | #300 | Tragic 80.2% |
| Spanish American Indians | 0.0 /100 | #301 | Tragic 80.2% |
Demographics Similar to Immigrants from Chile by In Labor Force | Age 45-54
In terms of in labor force | age 45-54, the demographic groups most similar to Immigrants from Chile are Assyrian/Chaldean/Syriac (83.2%, a difference of 0.0%), Immigrants from Malaysia (83.2%, a difference of 0.0%), Immigrants from Albania (83.2%, a difference of 0.010%), Immigrants from Afghanistan (83.2%, a difference of 0.020%), and Immigrants from China (83.2%, a difference of 0.020%).
| Demographics | Rating | Rank | In Labor Force | Age 45-54 |
| Slovaks | 92.8 /100 | #108 | Exceptional 83.2% |
| Ukrainians | 92.7 /100 | #109 | Exceptional 83.2% |
| Immigrants | Africa | 92.6 /100 | #110 | Exceptional 83.2% |
| Immigrants | Italy | 92.5 /100 | #111 | Exceptional 83.2% |
| Immigrants | Afghanistan | 92.4 /100 | #112 | Exceptional 83.2% |
| Immigrants | Albania | 91.8 /100 | #113 | Exceptional 83.2% |
| Assyrians/Chaldeans/Syriacs | 91.7 /100 | #114 | Exceptional 83.2% |
| Immigrants | Chile | 91.6 /100 | #115 | Exceptional 83.2% |
| Immigrants | Malaysia | 91.4 /100 | #116 | Exceptional 83.2% |
| Immigrants | China | 90.9 /100 | #117 | Exceptional 83.2% |
| Immigrants | Europe | 90.7 /100 | #118 | Exceptional 83.2% |
| Immigrants | Uruguay | 90.2 /100 | #119 | Exceptional 83.2% |
| Immigrants | Russia | 90.1 /100 | #120 | Exceptional 83.2% |
| Uruguayans | 89.4 /100 | #121 | Excellent 83.1% |
| Immigrants | Vietnam | 88.9 /100 | #122 | Excellent 83.1% |