Colombian vs Immigrants from Albania In Labor Force | Age 20-24
COMPARE
Colombian
Immigrants from Albania
In Labor Force | Age 20-24
In Labor Force | Age 20-24 Comparison
Colombians
Immigrants from Albania
73.5%
IN LABOR FORCE | AGE 20-24
0.3/ 100
METRIC RATING
269th/ 347
METRIC RANK
74.2%
IN LABOR FORCE | AGE 20-24
4.3/ 100
METRIC RATING
230th/ 347
METRIC RANK
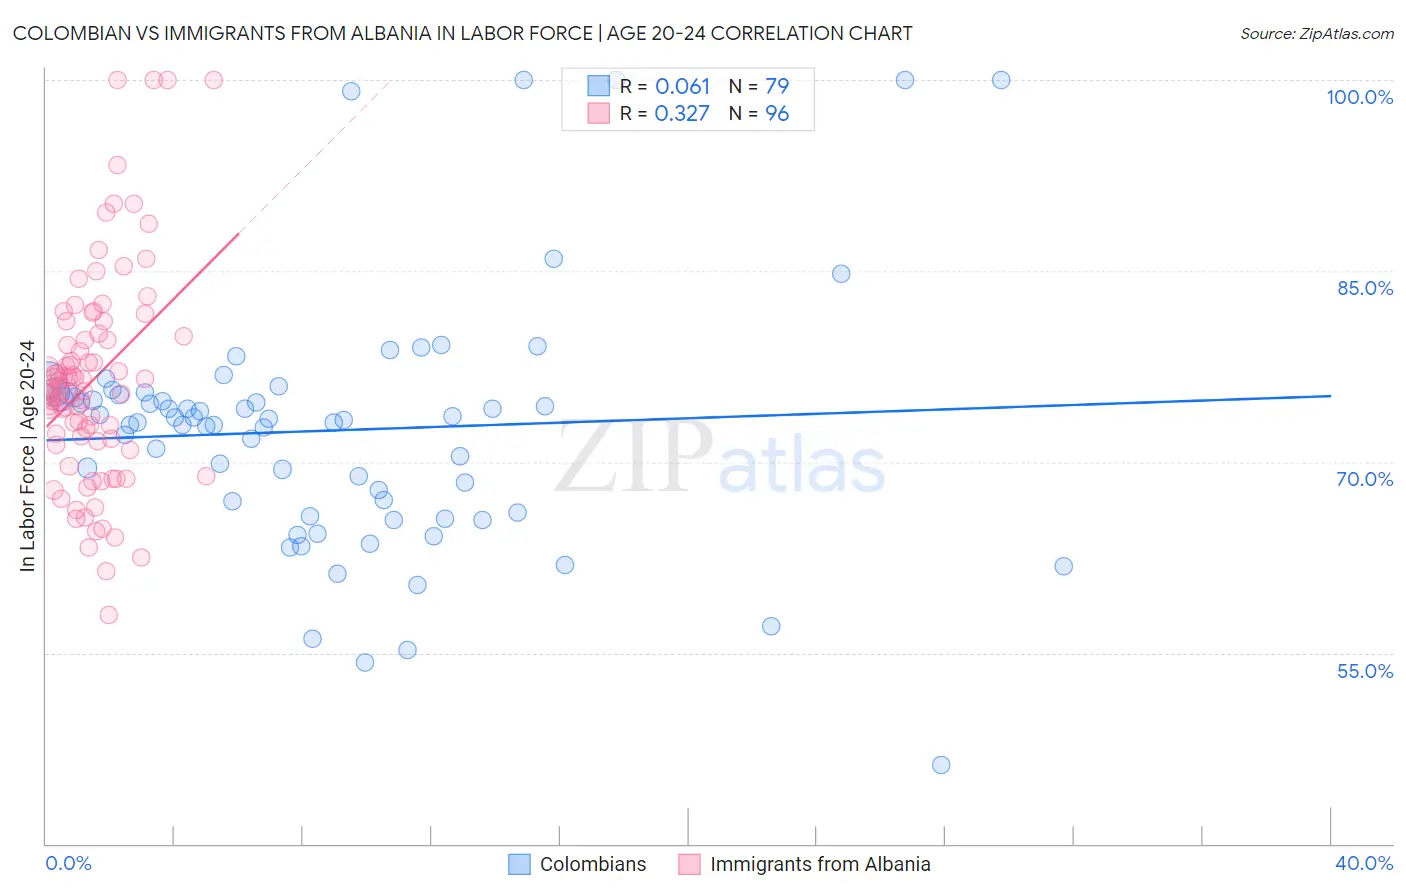
Colombian vs Immigrants from Albania In Labor Force | Age 20-24 Correlation Chart
The statistical analysis conducted on geographies consisting of 419,536,889 people shows a slight positive correlation between the proportion of Colombians and labor force participation rate among population between the ages 20 and 24 in the United States with a correlation coefficient (R) of 0.061 and weighted average of 73.5%. Similarly, the statistical analysis conducted on geographies consisting of 119,383,108 people shows a mild positive correlation between the proportion of Immigrants from Albania and labor force participation rate among population between the ages 20 and 24 in the United States with a correlation coefficient (R) of 0.327 and weighted average of 74.2%, a difference of 0.97%.
In Labor Force | Age 20-24 Correlation Summary
| Measurement | Colombian | Immigrants from Albania |
| Minimum | 46.2% | 58.0% |
| Maximum | 100.0% | 100.0% |
| Range | 53.8% | 42.0% |
| Mean | 72.5% | 76.4% |
| Median | 73.3% | 75.7% |
| Interquartile 25% (IQ1) | 66.0% | 71.7% |
| Interquartile 75% (IQ3) | 75.4% | 80.0% |
| Interquartile Range (IQR) | 9.4% | 8.3% |
| Standard Deviation (Sample) | 9.9% | 8.4% |
| Standard Deviation (Population) | 9.8% | 8.3% |
Similar Demographics by In Labor Force | Age 20-24
Demographics Similar to Colombians by In Labor Force | Age 20-24
In terms of in labor force | age 20-24, the demographic groups most similar to Colombians are South American (73.5%, a difference of 0.030%), Immigrants from Russia (73.5%, a difference of 0.030%), Immigrants from Western Asia (73.5%, a difference of 0.080%), Immigrants from Indonesia (73.4%, a difference of 0.090%), and Belizean (73.4%, a difference of 0.10%).
| Demographics | Rating | Rank | In Labor Force | Age 20-24 |
| Asians | 0.6 /100 | #262 | Tragic 73.7% |
| Immigrants | Asia | 0.5 /100 | #263 | Tragic 73.6% |
| Immigrants | Haiti | 0.5 /100 | #264 | Tragic 73.6% |
| Burmese | 0.5 /100 | #265 | Tragic 73.6% |
| Haitians | 0.5 /100 | #266 | Tragic 73.6% |
| Immigrants | Western Asia | 0.4 /100 | #267 | Tragic 73.5% |
| South Americans | 0.4 /100 | #268 | Tragic 73.5% |
| Colombians | 0.3 /100 | #269 | Tragic 73.5% |
| Immigrants | Russia | 0.3 /100 | #270 | Tragic 73.5% |
| Immigrants | Indonesia | 0.3 /100 | #271 | Tragic 73.4% |
| Belizeans | 0.3 /100 | #272 | Tragic 73.4% |
| Cheyenne | 0.2 /100 | #273 | Tragic 73.4% |
| Immigrants | Colombia | 0.2 /100 | #274 | Tragic 73.4% |
| Immigrants | South America | 0.2 /100 | #275 | Tragic 73.3% |
| Mongolians | 0.2 /100 | #276 | Tragic 73.3% |
Demographics Similar to Immigrants from Albania by In Labor Force | Age 20-24
In terms of in labor force | age 20-24, the demographic groups most similar to Immigrants from Albania are Immigrants from Greece (74.2%, a difference of 0.020%), Immigrants from Switzerland (74.2%, a difference of 0.020%), Immigrants from Sweden (74.2%, a difference of 0.030%), Immigrants from Ukraine (74.2%, a difference of 0.060%), and Immigrants from Chile (74.1%, a difference of 0.060%).
| Demographics | Rating | Rank | In Labor Force | Age 20-24 |
| Hispanics or Latinos | 7.9 /100 | #223 | Tragic 74.4% |
| Seminole | 6.9 /100 | #224 | Tragic 74.3% |
| Ghanaians | 6.2 /100 | #225 | Tragic 74.3% |
| Immigrants | Fiji | 5.9 /100 | #226 | Tragic 74.3% |
| Immigrants | Ireland | 5.8 /100 | #227 | Tragic 74.3% |
| Immigrants | Ukraine | 5.1 /100 | #228 | Tragic 74.2% |
| Immigrants | Sweden | 4.6 /100 | #229 | Tragic 74.2% |
| Immigrants | Albania | 4.3 /100 | #230 | Tragic 74.2% |
| Immigrants | Greece | 4.1 /100 | #231 | Tragic 74.2% |
| Immigrants | Switzerland | 4.1 /100 | #232 | Tragic 74.2% |
| Immigrants | Chile | 3.7 /100 | #233 | Tragic 74.1% |
| Immigrants | Immigrants | 3.6 /100 | #234 | Tragic 74.1% |
| Laotians | 3.5 /100 | #235 | Tragic 74.1% |
| Immigrants | France | 3.3 /100 | #236 | Tragic 74.1% |
| Bermudans | 3.2 /100 | #237 | Tragic 74.1% |