Native/Alaskan vs Immigrants from Bahamas In Labor Force | Age 45-54
COMPARE
Native/Alaskan
Immigrants from Bahamas
In Labor Force | Age 45-54
In Labor Force | Age 45-54 Comparison
Natives/Alaskans
Immigrants from Bahamas
77.1%
IN LABOR FORCE | AGE 45-54
0.0/ 100
METRIC RATING
333rd/ 347
METRIC RANK
82.3%
IN LABOR FORCE | AGE 45-54
7.1/ 100
METRIC RATING
210th/ 347
METRIC RANK
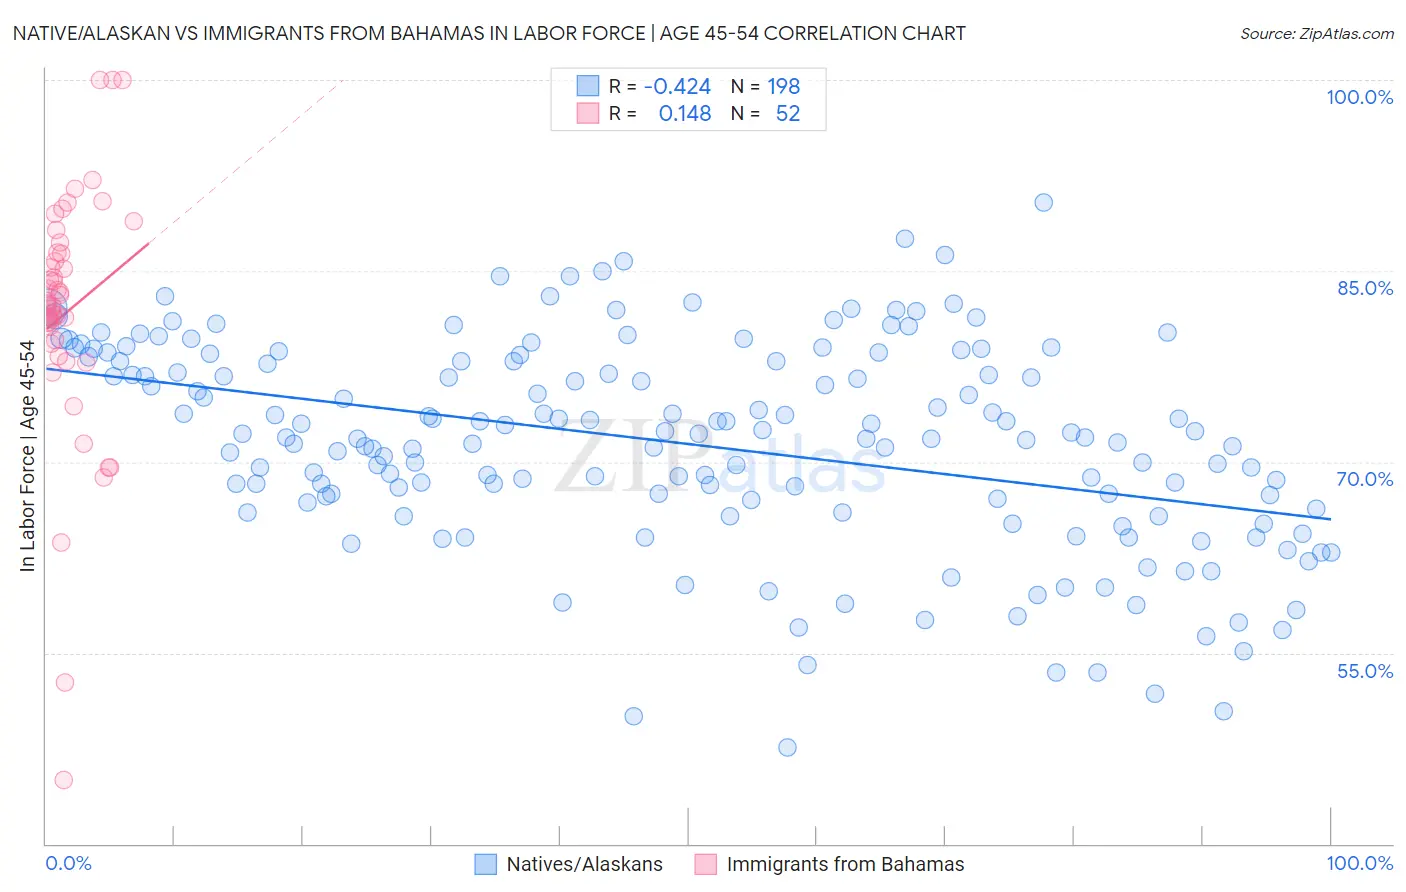
Native/Alaskan vs Immigrants from Bahamas In Labor Force | Age 45-54 Correlation Chart
The statistical analysis conducted on geographies consisting of 512,575,279 people shows a moderate negative correlation between the proportion of Natives/Alaskans and labor force participation rate among population between the ages 45 and 54 in the United States with a correlation coefficient (R) of -0.424 and weighted average of 77.1%. Similarly, the statistical analysis conducted on geographies consisting of 104,597,617 people shows a poor positive correlation between the proportion of Immigrants from Bahamas and labor force participation rate among population between the ages 45 and 54 in the United States with a correlation coefficient (R) of 0.148 and weighted average of 82.3%, a difference of 6.7%.
In Labor Force | Age 45-54 Correlation Summary
| Measurement | Native/Alaskan | Immigrants from Bahamas |
| Minimum | 47.6% | 45.0% |
| Maximum | 90.4% | 100.0% |
| Range | 42.8% | 55.0% |
| Mean | 71.4% | 81.8% |
| Median | 72.0% | 82.4% |
| Interquartile 25% (IQ1) | 66.8% | 79.4% |
| Interquartile 75% (IQ3) | 77.9% | 86.4% |
| Interquartile Range (IQR) | 11.1% | 7.0% |
| Standard Deviation (Sample) | 8.1% | 9.8% |
| Standard Deviation (Population) | 8.1% | 9.7% |
Similar Demographics by In Labor Force | Age 45-54
Demographics Similar to Natives/Alaskans by In Labor Force | Age 45-54
In terms of in labor force | age 45-54, the demographic groups most similar to Natives/Alaskans are Apache (77.1%, a difference of 0.0%), Arapaho (77.1%, a difference of 0.070%), Menominee (77.4%, a difference of 0.36%), Tsimshian (77.4%, a difference of 0.39%), and Cheyenne (77.6%, a difference of 0.54%).
| Demographics | Rating | Rank | In Labor Force | Age 45-54 |
| Seminole | 0.0 /100 | #326 | Tragic 78.1% |
| Cajuns | 0.0 /100 | #327 | Tragic 78.1% |
| Sioux | 0.0 /100 | #328 | Tragic 78.0% |
| Creek | 0.0 /100 | #329 | Tragic 77.7% |
| Cheyenne | 0.0 /100 | #330 | Tragic 77.6% |
| Tsimshian | 0.0 /100 | #331 | Tragic 77.4% |
| Menominee | 0.0 /100 | #332 | Tragic 77.4% |
| Natives/Alaskans | 0.0 /100 | #333 | Tragic 77.1% |
| Apache | 0.0 /100 | #334 | Tragic 77.1% |
| Arapaho | 0.0 /100 | #335 | Tragic 77.1% |
| Paiute | 0.0 /100 | #336 | Tragic 76.7% |
| Ute | 0.0 /100 | #337 | Tragic 76.6% |
| Yuman | 0.0 /100 | #338 | Tragic 76.3% |
| Puerto Ricans | 0.0 /100 | #339 | Tragic 75.9% |
| Lumbee | 0.0 /100 | #340 | Tragic 75.6% |
Demographics Similar to Immigrants from Bahamas by In Labor Force | Age 45-54
In terms of in labor force | age 45-54, the demographic groups most similar to Immigrants from Bahamas are Immigrants from Lebanon (82.3%, a difference of 0.010%), Immigrants from Syria (82.3%, a difference of 0.020%), Ecuadorian (82.3%, a difference of 0.030%), Immigrants from Cabo Verde (82.3%, a difference of 0.040%), and Native Hawaiian (82.3%, a difference of 0.040%).
| Demographics | Rating | Rank | In Labor Force | Age 45-54 |
| Arabs | 11.6 /100 | #203 | Poor 82.4% |
| Immigrants | Western Europe | 10.9 /100 | #204 | Poor 82.4% |
| Senegalese | 9.5 /100 | #205 | Tragic 82.4% |
| Welsh | 9.2 /100 | #206 | Tragic 82.3% |
| Immigrants | Cabo Verde | 8.6 /100 | #207 | Tragic 82.3% |
| Native Hawaiians | 8.5 /100 | #208 | Tragic 82.3% |
| Immigrants | Lebanon | 7.4 /100 | #209 | Tragic 82.3% |
| Immigrants | Bahamas | 7.1 /100 | #210 | Tragic 82.3% |
| Immigrants | Syria | 6.6 /100 | #211 | Tragic 82.3% |
| Ecuadorians | 6.3 /100 | #212 | Tragic 82.3% |
| Immigrants | Uzbekistan | 5.8 /100 | #213 | Tragic 82.3% |
| Immigrants | Panama | 5.6 /100 | #214 | Tragic 82.2% |
| Iraqis | 5.6 /100 | #215 | Tragic 82.2% |
| Scottish | 5.3 /100 | #216 | Tragic 82.2% |
| Portuguese | 4.7 /100 | #217 | Tragic 82.2% |