Immigrants from Belize vs Romanian In Labor Force | Age 35-44
COMPARE
Immigrants from Belize
Romanian
In Labor Force | Age 35-44
In Labor Force | Age 35-44 Comparison
Immigrants from Belize
Romanians
82.9%
IN LABOR FORCE | AGE 35-44
0.0/ 100
METRIC RATING
287th/ 347
METRIC RANK
84.5%
IN LABOR FORCE | AGE 35-44
72.1/ 100
METRIC RATING
151st/ 347
METRIC RANK
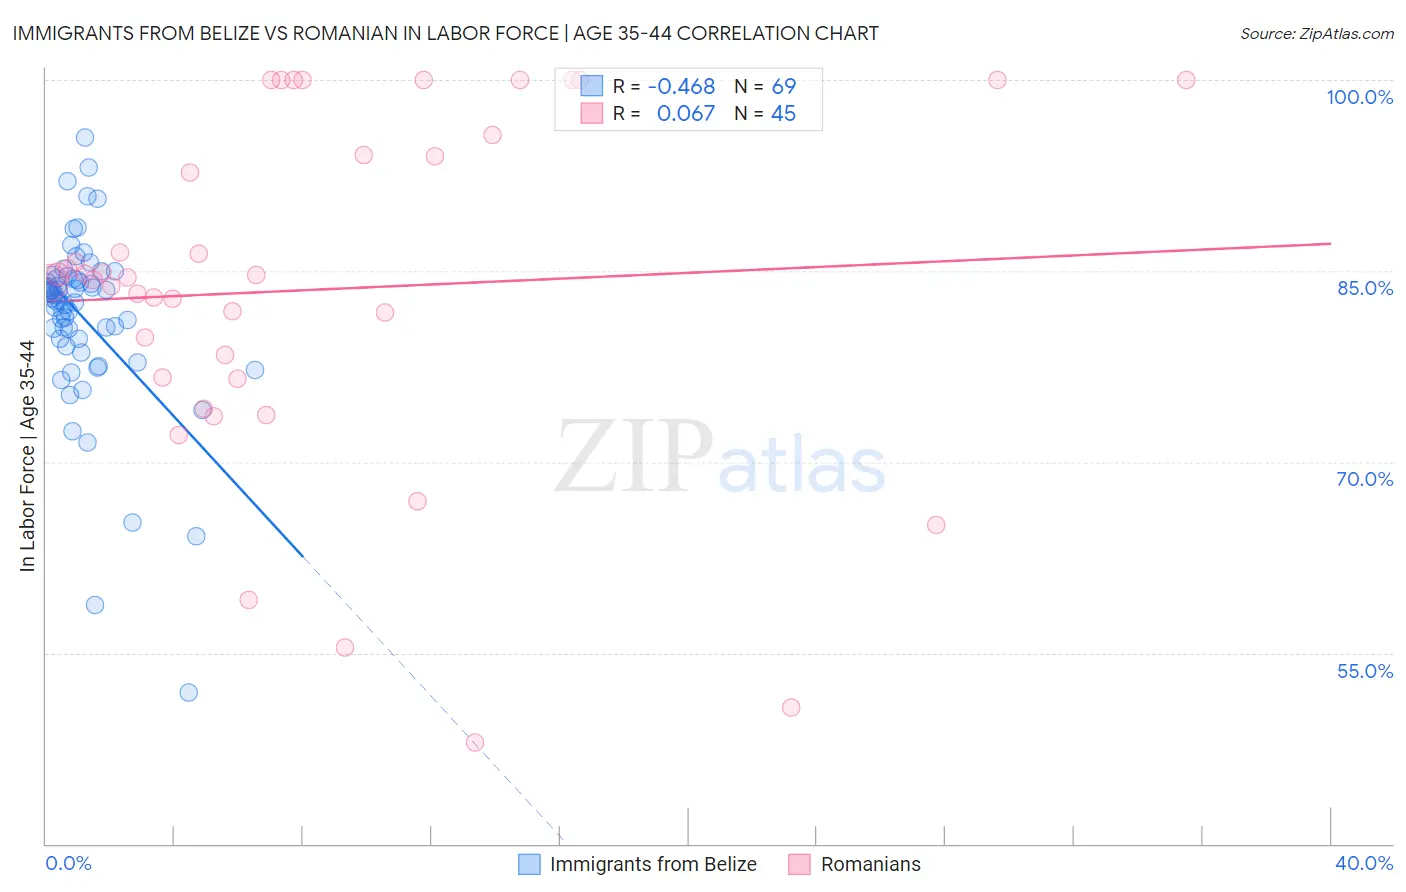
Immigrants from Belize vs Romanian In Labor Force | Age 35-44 Correlation Chart
The statistical analysis conducted on geographies consisting of 130,306,944 people shows a moderate negative correlation between the proportion of Immigrants from Belize and labor force participation rate among population between the ages 35 and 44 in the United States with a correlation coefficient (R) of -0.468 and weighted average of 82.9%. Similarly, the statistical analysis conducted on geographies consisting of 377,740,706 people shows a slight positive correlation between the proportion of Romanians and labor force participation rate among population between the ages 35 and 44 in the United States with a correlation coefficient (R) of 0.067 and weighted average of 84.5%, a difference of 1.9%.
In Labor Force | Age 35-44 Correlation Summary
| Measurement | Immigrants from Belize | Romanian |
| Minimum | 51.9% | 48.0% |
| Maximum | 95.5% | 100.0% |
| Range | 43.6% | 52.0% |
| Mean | 81.3% | 83.5% |
| Median | 82.8% | 84.5% |
| Interquartile 25% (IQ1) | 79.3% | 76.6% |
| Interquartile 75% (IQ3) | 84.4% | 94.9% |
| Interquartile Range (IQR) | 5.1% | 18.3% |
| Standard Deviation (Sample) | 7.0% | 13.6% |
| Standard Deviation (Population) | 7.0% | 13.4% |
Similar Demographics by In Labor Force | Age 35-44
Demographics Similar to Immigrants from Belize by In Labor Force | Age 35-44
In terms of in labor force | age 35-44, the demographic groups most similar to Immigrants from Belize are Fijian (82.9%, a difference of 0.0%), Immigrants from Bangladesh (82.9%, a difference of 0.0%), Immigrants from Dominican Republic (82.9%, a difference of 0.020%), Puget Sound Salish (82.9%, a difference of 0.020%), and Osage (82.9%, a difference of 0.030%).
| Demographics | Rating | Rank | In Labor Force | Age 35-44 |
| Dominicans | 0.0 /100 | #280 | Tragic 83.1% |
| Guatemalans | 0.0 /100 | #281 | Tragic 83.0% |
| Osage | 0.0 /100 | #282 | Tragic 82.9% |
| Immigrants | Guatemala | 0.0 /100 | #283 | Tragic 82.9% |
| Immigrants | Dominican Republic | 0.0 /100 | #284 | Tragic 82.9% |
| Fijians | 0.0 /100 | #285 | Tragic 82.9% |
| Immigrants | Bangladesh | 0.0 /100 | #286 | Tragic 82.9% |
| Immigrants | Belize | 0.0 /100 | #287 | Tragic 82.9% |
| Puget Sound Salish | 0.0 /100 | #288 | Tragic 82.9% |
| Chippewa | 0.0 /100 | #289 | Tragic 82.9% |
| Africans | 0.0 /100 | #290 | Tragic 82.9% |
| Pennsylvania Germans | 0.0 /100 | #291 | Tragic 82.9% |
| Immigrants | Latin America | 0.0 /100 | #292 | Tragic 82.8% |
| Spanish Americans | 0.0 /100 | #293 | Tragic 82.8% |
| Potawatomi | 0.0 /100 | #294 | Tragic 82.7% |
Demographics Similar to Romanians by In Labor Force | Age 35-44
In terms of in labor force | age 35-44, the demographic groups most similar to Romanians are South American Indian (84.5%, a difference of 0.010%), Okinawan (84.5%, a difference of 0.010%), Immigrants from Nigeria (84.5%, a difference of 0.010%), Immigrants from Taiwan (84.5%, a difference of 0.010%), and Trinidadian and Tobagonian (84.5%, a difference of 0.020%).
| Demographics | Rating | Rank | In Labor Force | Age 35-44 |
| Immigrants | Jamaica | 79.4 /100 | #144 | Good 84.6% |
| Immigrants | Saudi Arabia | 79.4 /100 | #145 | Good 84.6% |
| Immigrants | Asia | 78.7 /100 | #146 | Good 84.5% |
| Immigrants | Netherlands | 76.6 /100 | #147 | Good 84.5% |
| South American Indians | 73.6 /100 | #148 | Good 84.5% |
| Okinawans | 73.5 /100 | #149 | Good 84.5% |
| Immigrants | Nigeria | 73.3 /100 | #150 | Good 84.5% |
| Romanians | 72.1 /100 | #151 | Good 84.5% |
| Immigrants | Taiwan | 71.4 /100 | #152 | Good 84.5% |
| Trinidadians and Tobagonians | 69.5 /100 | #153 | Good 84.5% |
| Iranians | 69.4 /100 | #154 | Good 84.5% |
| Immigrants | Switzerland | 65.9 /100 | #155 | Good 84.5% |
| Immigrants | Israel | 64.3 /100 | #156 | Good 84.4% |
| Immigrants | Austria | 63.8 /100 | #157 | Good 84.4% |
| Jamaicans | 62.7 /100 | #158 | Good 84.4% |