Native Hawaiian vs Finnish Unemployment Among Ages 30 to 34 years
COMPARE
Native Hawaiian
Finnish
Unemployment Among Ages 30 to 34 years
Unemployment Among Ages 30 to 34 years Comparison
Native Hawaiians
Finns
5.9%
UNEMPLOYMENT AMONG AGES 30 TO 34 YEARS
0.7/ 100
METRIC RATING
236th/ 347
METRIC RANK
5.5%
UNEMPLOYMENT AMONG AGES 30 TO 34 YEARS
30.7/ 100
METRIC RATING
195th/ 347
METRIC RANK
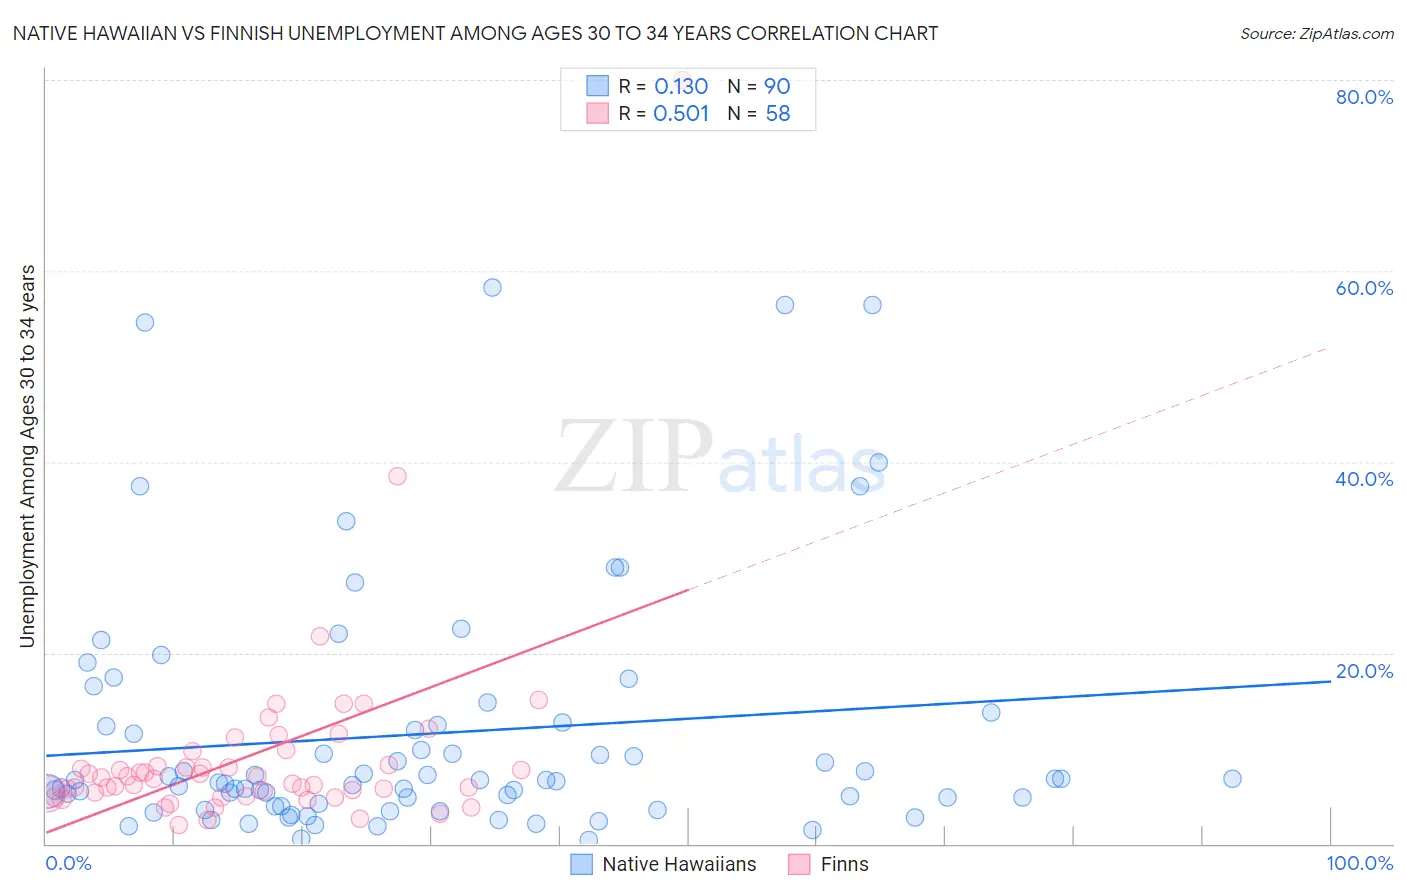
Native Hawaiian vs Finnish Unemployment Among Ages 30 to 34 years Correlation Chart
The statistical analysis conducted on geographies consisting of 317,081,613 people shows a poor positive correlation between the proportion of Native Hawaiians and unemployment rate among population between the ages 30 and 34 in the United States with a correlation coefficient (R) of 0.130 and weighted average of 5.9%. Similarly, the statistical analysis conducted on geographies consisting of 373,300,326 people shows a substantial positive correlation between the proportion of Finns and unemployment rate among population between the ages 30 and 34 in the United States with a correlation coefficient (R) of 0.501 and weighted average of 5.5%, a difference of 7.1%.
Unemployment Among Ages 30 to 34 years Correlation Summary
| Measurement | Native Hawaiian | Finnish |
| Minimum | 0.40% | 1.9% |
| Maximum | 58.2% | 80.0% |
| Range | 57.8% | 78.1% |
| Mean | 11.5% | 9.2% |
| Median | 6.6% | 6.9% |
| Interquartile 25% (IQ1) | 4.2% | 5.3% |
| Interquartile 75% (IQ3) | 12.5% | 8.2% |
| Interquartile Range (IQR) | 8.3% | 2.9% |
| Standard Deviation (Sample) | 13.0% | 10.9% |
| Standard Deviation (Population) | 12.9% | 10.8% |
Similar Demographics by Unemployment Among Ages 30 to 34 years
Demographics Similar to Native Hawaiians by Unemployment Among Ages 30 to 34 years
In terms of unemployment among ages 30 to 34 years, the demographic groups most similar to Native Hawaiians are Yaqui (5.9%, a difference of 0.12%), Central American (5.9%, a difference of 0.17%), Portuguese (5.9%, a difference of 0.24%), Mexican American Indian (5.9%, a difference of 0.26%), and Nepalese (5.9%, a difference of 0.27%).
| Demographics | Rating | Rank | Unemployment Among Ages 30 to 34 years |
| Immigrants | Uzbekistan | 1.5 /100 | #229 | Tragic 5.9% |
| Hawaiians | 1.2 /100 | #230 | Tragic 5.9% |
| Japanese | 1.1 /100 | #231 | Tragic 5.9% |
| Iroquois | 1.0 /100 | #232 | Tragic 5.9% |
| Nepalese | 0.8 /100 | #233 | Tragic 5.9% |
| Portuguese | 0.8 /100 | #234 | Tragic 5.9% |
| Yaqui | 0.7 /100 | #235 | Tragic 5.9% |
| Native Hawaiians | 0.7 /100 | #236 | Tragic 5.9% |
| Central Americans | 0.6 /100 | #237 | Tragic 5.9% |
| Mexican American Indians | 0.6 /100 | #238 | Tragic 5.9% |
| Immigrants | Nigeria | 0.6 /100 | #239 | Tragic 6.0% |
| Salvadorans | 0.5 /100 | #240 | Tragic 6.0% |
| Immigrants | El Salvador | 0.5 /100 | #241 | Tragic 6.0% |
| Guatemalans | 0.4 /100 | #242 | Tragic 6.0% |
| Immigrants | Liberia | 0.4 /100 | #243 | Tragic 6.0% |
Demographics Similar to Finns by Unemployment Among Ages 30 to 34 years
In terms of unemployment among ages 30 to 34 years, the demographic groups most similar to Finns are Slavic (5.5%, a difference of 0.010%), Immigrants from Africa (5.5%, a difference of 0.030%), Moroccan (5.5%, a difference of 0.040%), Irish (5.5%, a difference of 0.050%), and Immigrants from South America (5.5%, a difference of 0.070%).
| Demographics | Rating | Rank | Unemployment Among Ages 30 to 34 years |
| Immigrants | Norway | 36.1 /100 | #188 | Fair 5.5% |
| Immigrants | England | 35.7 /100 | #189 | Fair 5.5% |
| Immigrants | Kazakhstan | 33.9 /100 | #190 | Fair 5.5% |
| Irish | 31.3 /100 | #191 | Fair 5.5% |
| Moroccans | 31.2 /100 | #192 | Fair 5.5% |
| Immigrants | Africa | 31.0 /100 | #193 | Fair 5.5% |
| Slavs | 30.9 /100 | #194 | Fair 5.5% |
| Finns | 30.7 /100 | #195 | Fair 5.5% |
| Immigrants | South America | 29.8 /100 | #196 | Fair 5.5% |
| Immigrants | Nicaragua | 28.9 /100 | #197 | Fair 5.5% |
| Immigrants | Afghanistan | 27.2 /100 | #198 | Fair 5.6% |
| Nicaraguans | 26.6 /100 | #199 | Fair 5.6% |
| Immigrants | Southern Europe | 25.8 /100 | #200 | Fair 5.6% |
| South American Indians | 24.4 /100 | #201 | Fair 5.6% |
| Immigrants | Germany | 22.9 /100 | #202 | Fair 5.6% |