Immigrants from Kenya vs Moroccan In Labor Force | Age 35-44
COMPARE
Immigrants from Kenya
Moroccan
In Labor Force | Age 35-44
In Labor Force | Age 35-44 Comparison
Immigrants from Kenya
Moroccans
85.1%
IN LABOR FORCE | AGE 35-44
99.6/ 100
METRIC RATING
52nd/ 347
METRIC RANK
84.2%
IN LABOR FORCE | AGE 35-44
23.2/ 100
METRIC RATING
200th/ 347
METRIC RANK
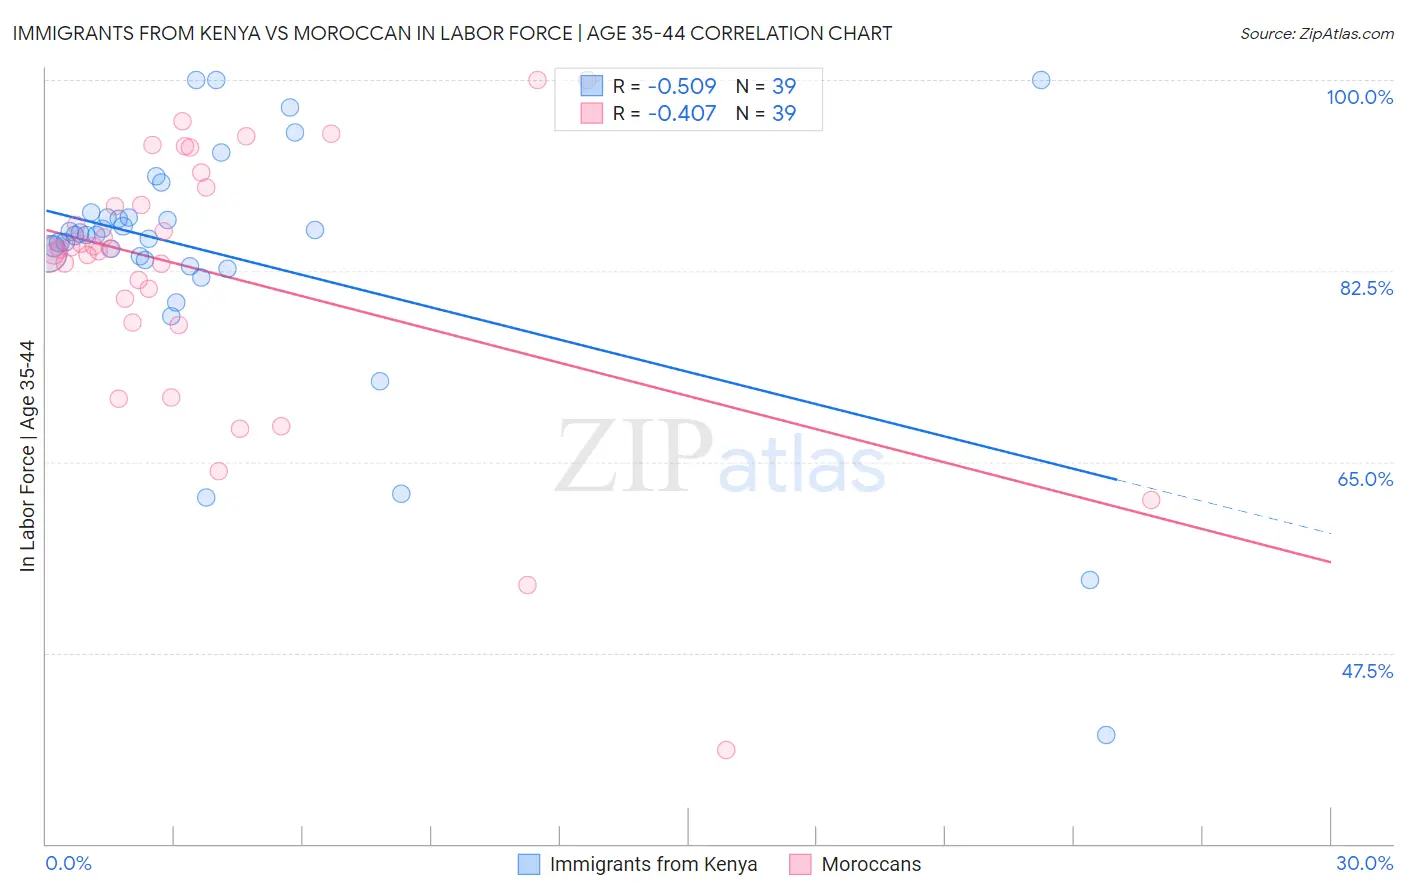
Immigrants from Kenya vs Moroccan In Labor Force | Age 35-44 Correlation Chart
The statistical analysis conducted on geographies consisting of 218,019,455 people shows a substantial negative correlation between the proportion of Immigrants from Kenya and labor force participation rate among population between the ages 35 and 44 in the United States with a correlation coefficient (R) of -0.509 and weighted average of 85.1%. Similarly, the statistical analysis conducted on geographies consisting of 201,769,672 people shows a moderate negative correlation between the proportion of Moroccans and labor force participation rate among population between the ages 35 and 44 in the United States with a correlation coefficient (R) of -0.407 and weighted average of 84.2%, a difference of 1.1%.
In Labor Force | Age 35-44 Correlation Summary
| Measurement | Immigrants from Kenya | Moroccan |
| Minimum | 40.0% | 38.6% |
| Maximum | 100.0% | 100.0% |
| Range | 60.0% | 61.4% |
| Mean | 83.7% | 82.2% |
| Median | 85.8% | 84.5% |
| Interquartile 25% (IQ1) | 82.9% | 77.7% |
| Interquartile 75% (IQ3) | 87.5% | 90.1% |
| Interquartile Range (IQR) | 4.6% | 12.4% |
| Standard Deviation (Sample) | 11.9% | 12.6% |
| Standard Deviation (Population) | 11.7% | 12.5% |
Similar Demographics by In Labor Force | Age 35-44
Demographics Similar to Immigrants from Kenya by In Labor Force | Age 35-44
In terms of in labor force | age 35-44, the demographic groups most similar to Immigrants from Kenya are Taiwanese (85.1%, a difference of 0.010%), Immigrants from Albania (85.1%, a difference of 0.030%), Turkish (85.1%, a difference of 0.030%), Soviet Union (85.1%, a difference of 0.030%), and Thai (85.2%, a difference of 0.040%).
| Demographics | Rating | Rank | In Labor Force | Age 35-44 |
| Cypriots | 99.8 /100 | #45 | Exceptional 85.2% |
| Immigrants | Hong Kong | 99.8 /100 | #46 | Exceptional 85.2% |
| German Russians | 99.8 /100 | #47 | Exceptional 85.2% |
| Immigrants | Eritrea | 99.7 /100 | #48 | Exceptional 85.2% |
| Croatians | 99.7 /100 | #49 | Exceptional 85.2% |
| Thais | 99.7 /100 | #50 | Exceptional 85.2% |
| Immigrants | Albania | 99.7 /100 | #51 | Exceptional 85.1% |
| Immigrants | Kenya | 99.6 /100 | #52 | Exceptional 85.1% |
| Taiwanese | 99.6 /100 | #53 | Exceptional 85.1% |
| Turks | 99.5 /100 | #54 | Exceptional 85.1% |
| Soviet Union | 99.5 /100 | #55 | Exceptional 85.1% |
| Immigrants | Croatia | 99.5 /100 | #56 | Exceptional 85.1% |
| Chinese | 99.4 /100 | #57 | Exceptional 85.1% |
| Slovaks | 99.4 /100 | #58 | Exceptional 85.1% |
| Serbians | 99.4 /100 | #59 | Exceptional 85.1% |
Demographics Similar to Moroccans by In Labor Force | Age 35-44
In terms of in labor force | age 35-44, the demographic groups most similar to Moroccans are Syrian (84.2%, a difference of 0.0%), British (84.2%, a difference of 0.0%), Immigrants from Uzbekistan (84.2%, a difference of 0.0%), Immigrants from Western Europe (84.2%, a difference of 0.010%), and Ecuadorian (84.2%, a difference of 0.010%).
| Demographics | Rating | Rank | In Labor Force | Age 35-44 |
| Hungarians | 26.8 /100 | #193 | Fair 84.2% |
| Immigrants | Indonesia | 25.7 /100 | #194 | Fair 84.2% |
| Immigrants | Caribbean | 25.7 /100 | #195 | Fair 84.2% |
| Immigrants | England | 25.0 /100 | #196 | Fair 84.2% |
| Immigrants | Western Europe | 24.7 /100 | #197 | Fair 84.2% |
| Ecuadorians | 24.0 /100 | #198 | Fair 84.2% |
| Syrians | 23.2 /100 | #199 | Fair 84.2% |
| Moroccans | 23.2 /100 | #200 | Fair 84.2% |
| British | 23.0 /100 | #201 | Fair 84.2% |
| Immigrants | Uzbekistan | 22.8 /100 | #202 | Fair 84.2% |
| Immigrants | South Eastern Asia | 22.4 /100 | #203 | Fair 84.2% |
| Canadians | 19.9 /100 | #204 | Poor 84.2% |
| Immigrants | Canada | 19.6 /100 | #205 | Poor 84.2% |
| Immigrants | Costa Rica | 19.5 /100 | #206 | Poor 84.2% |
| Laotians | 19.0 /100 | #207 | Poor 84.2% |