Marshallese vs Immigrants from Sweden 7th Grade
COMPARE
Marshallese
Immigrants from Sweden
7th Grade
7th Grade Comparison
Marshallese
Immigrants from Sweden
96.0%
7TH GRADE
48.4/ 100
METRIC RATING
178th/ 347
METRIC RANK
96.7%
7TH GRADE
98.7/ 100
METRIC RATING
98th/ 347
METRIC RANK
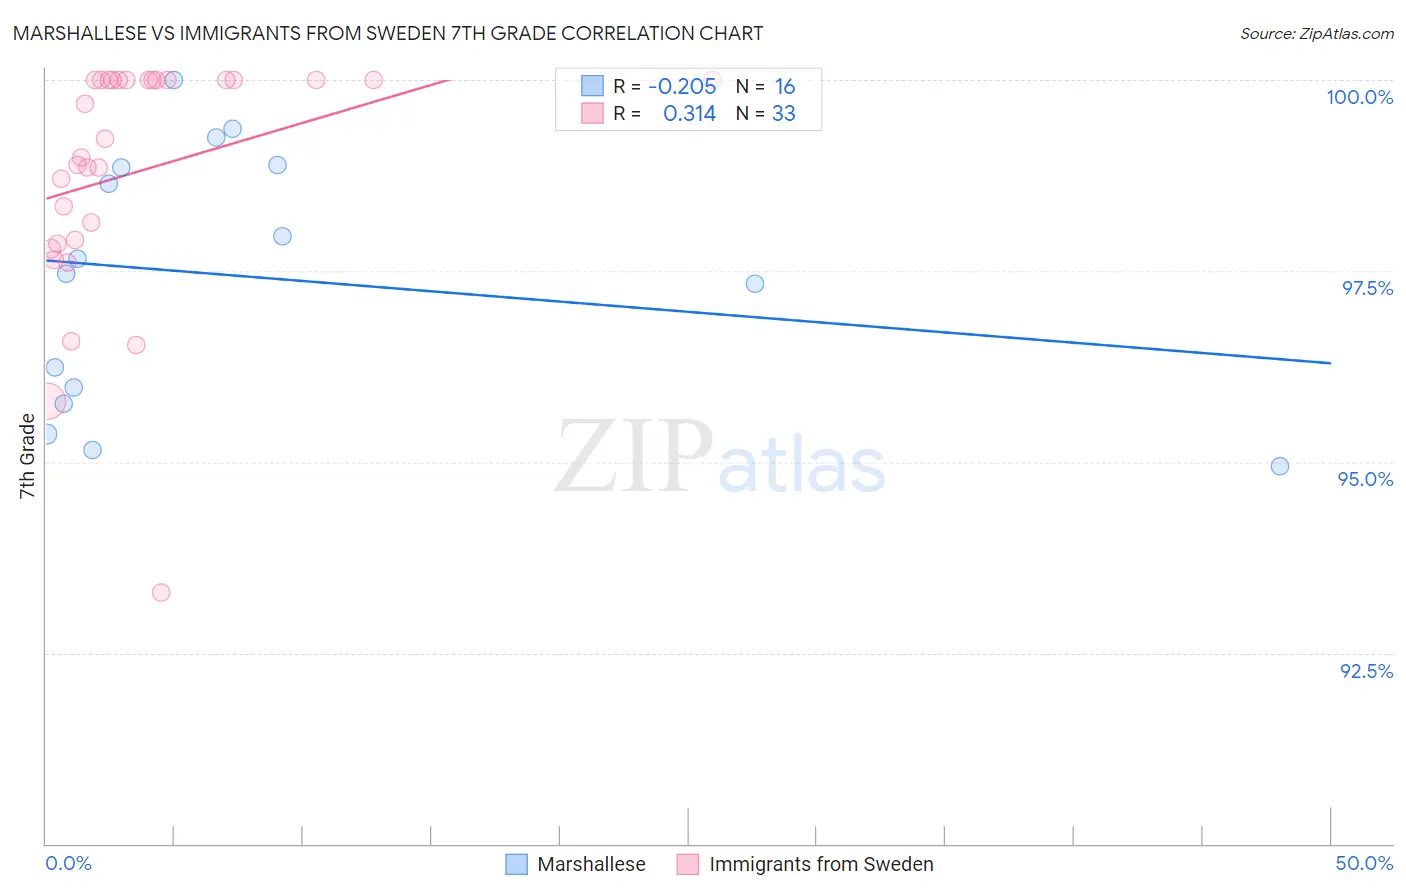
Marshallese vs Immigrants from Sweden 7th Grade Correlation Chart
The statistical analysis conducted on geographies consisting of 14,761,315 people shows a weak negative correlation between the proportion of Marshallese and percentage of population with at least 7th grade education in the United States with a correlation coefficient (R) of -0.205 and weighted average of 96.0%. Similarly, the statistical analysis conducted on geographies consisting of 164,737,275 people shows a mild positive correlation between the proportion of Immigrants from Sweden and percentage of population with at least 7th grade education in the United States with a correlation coefficient (R) of 0.314 and weighted average of 96.7%, a difference of 0.67%.
7th Grade Correlation Summary
| Measurement | Marshallese | Immigrants from Sweden |
| Minimum | 94.9% | 93.3% |
| Maximum | 100.0% | 100.0% |
| Range | 5.1% | 6.7% |
| Mean | 97.4% | 98.8% |
| Median | 97.6% | 99.2% |
| Interquartile 25% (IQ1) | 95.9% | 97.9% |
| Interquartile 75% (IQ3) | 98.9% | 100.0% |
| Interquartile Range (IQR) | 3.0% | 2.1% |
| Standard Deviation (Sample) | 1.7% | 1.6% |
| Standard Deviation (Population) | 1.6% | 1.5% |
Similar Demographics by 7th Grade
Demographics Similar to Marshallese by 7th Grade
In terms of 7th grade, the demographic groups most similar to Marshallese are Immigrants from Korea (96.0%, a difference of 0.0%), Immigrants from Iran (96.0%, a difference of 0.0%), Immigrants from Albania (96.0%, a difference of 0.010%), Mongolian (96.0%, a difference of 0.010%), and Black/African American (96.0%, a difference of 0.010%).
| Demographics | Rating | Rank | 7th Grade |
| Egyptians | 54.2 /100 | #171 | Average 96.1% |
| Venezuelans | 51.4 /100 | #172 | Average 96.0% |
| Immigrants | Albania | 50.4 /100 | #173 | Average 96.0% |
| Mongolians | 50.0 /100 | #174 | Average 96.0% |
| Blacks/African Americans | 49.5 /100 | #175 | Average 96.0% |
| Chileans | 49.3 /100 | #176 | Average 96.0% |
| Immigrants | Korea | 49.2 /100 | #177 | Average 96.0% |
| Marshallese | 48.4 /100 | #178 | Average 96.0% |
| Immigrants | Iran | 47.8 /100 | #179 | Average 96.0% |
| Immigrants | Brazil | 46.8 /100 | #180 | Average 96.0% |
| Pakistanis | 44.5 /100 | #181 | Average 96.0% |
| Iraqis | 41.2 /100 | #182 | Average 96.0% |
| Immigrants | Spain | 38.8 /100 | #183 | Fair 96.0% |
| Sierra Leoneans | 37.5 /100 | #184 | Fair 96.0% |
| Brazilians | 37.3 /100 | #185 | Fair 96.0% |
Demographics Similar to Immigrants from Sweden by 7th Grade
In terms of 7th grade, the demographic groups most similar to Immigrants from Sweden are Immigrants from Denmark (96.7%, a difference of 0.0%), Immigrants from Germany (96.7%, a difference of 0.0%), Menominee (96.7%, a difference of 0.0%), Immigrants from Australia (96.7%, a difference of 0.010%), and German Russian (96.7%, a difference of 0.010%).
| Demographics | Rating | Rank | 7th Grade |
| Osage | 98.9 /100 | #91 | Exceptional 96.7% |
| Immigrants | Western Europe | 98.9 /100 | #92 | Exceptional 96.7% |
| Potawatomi | 98.9 /100 | #93 | Exceptional 96.7% |
| Lebanese | 98.8 /100 | #94 | Exceptional 96.7% |
| Immigrants | Australia | 98.8 /100 | #95 | Exceptional 96.7% |
| Immigrants | Denmark | 98.7 /100 | #96 | Exceptional 96.7% |
| Immigrants | Germany | 98.7 /100 | #97 | Exceptional 96.7% |
| Immigrants | Sweden | 98.7 /100 | #98 | Exceptional 96.7% |
| Menominee | 98.7 /100 | #99 | Exceptional 96.7% |
| German Russians | 98.6 /100 | #100 | Exceptional 96.7% |
| Thais | 98.6 /100 | #101 | Exceptional 96.7% |
| Immigrants | Czechoslovakia | 98.3 /100 | #102 | Exceptional 96.6% |
| Immigrants | Singapore | 98.3 /100 | #103 | Exceptional 96.6% |
| Shoshone | 98.1 /100 | #104 | Exceptional 96.6% |
| South Africans | 98.0 /100 | #105 | Exceptional 96.6% |