Marshallese vs Alaskan Athabascan In Labor Force | Age 20-64
COMPARE
Marshallese
Alaskan Athabascan
In Labor Force | Age 20-64
In Labor Force | Age 20-64 Comparison
Marshallese
Alaskan Athabascans
78.3%
IN LABOR FORCE | AGE 20-64
0.0/ 100
METRIC RATING
272nd/ 347
METRIC RANK
76.9%
IN LABOR FORCE | AGE 20-64
0.0/ 100
METRIC RATING
312th/ 347
METRIC RANK
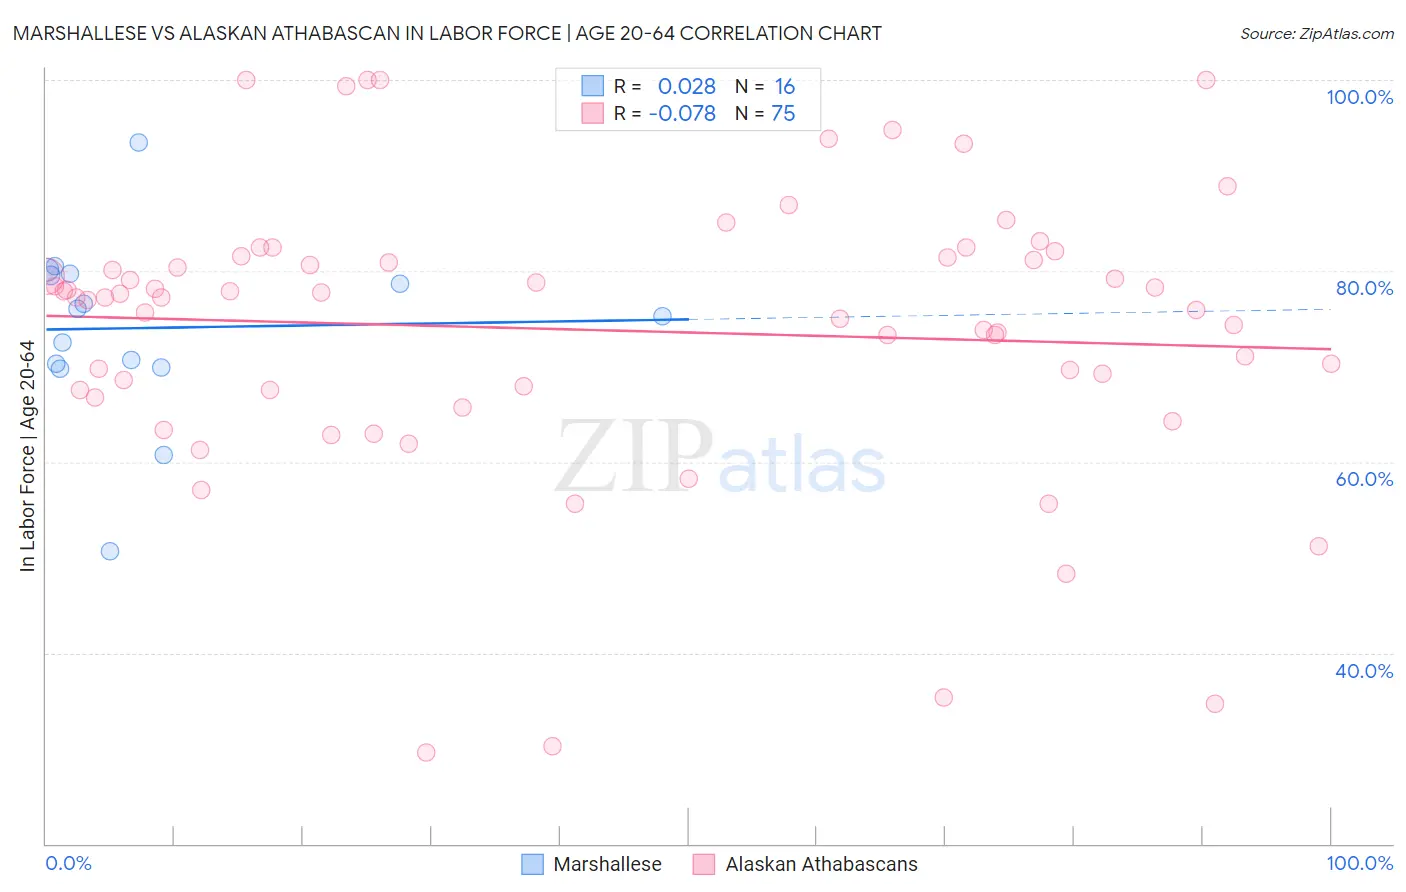
Marshallese vs Alaskan Athabascan In Labor Force | Age 20-64 Correlation Chart
The statistical analysis conducted on geographies consisting of 14,761,315 people shows no correlation between the proportion of Marshallese and labor force participation rate among population between the ages 20 and 64 in the United States with a correlation coefficient (R) of 0.028 and weighted average of 78.3%. Similarly, the statistical analysis conducted on geographies consisting of 45,821,503 people shows a slight negative correlation between the proportion of Alaskan Athabascans and labor force participation rate among population between the ages 20 and 64 in the United States with a correlation coefficient (R) of -0.078 and weighted average of 76.9%, a difference of 1.8%.
In Labor Force | Age 20-64 Correlation Summary
| Measurement | Marshallese | Alaskan Athabascan |
| Minimum | 50.6% | 29.5% |
| Maximum | 93.5% | 100.0% |
| Range | 42.9% | 70.5% |
| Mean | 74.0% | 73.8% |
| Median | 75.7% | 77.2% |
| Interquartile 25% (IQ1) | 70.1% | 67.5% |
| Interquartile 75% (IQ3) | 79.6% | 81.4% |
| Interquartile Range (IQR) | 9.5% | 13.9% |
| Standard Deviation (Sample) | 9.5% | 15.0% |
| Standard Deviation (Population) | 9.2% | 14.9% |
Similar Demographics by In Labor Force | Age 20-64
Demographics Similar to Marshallese by In Labor Force | Age 20-64
In terms of in labor force | age 20-64, the demographic groups most similar to Marshallese are Immigrants from Latin America (78.3%, a difference of 0.0%), Scotch-Irish (78.3%, a difference of 0.020%), Immigrants from Barbados (78.3%, a difference of 0.040%), French American Indian (78.2%, a difference of 0.040%), and Aleut (78.2%, a difference of 0.070%).
| Demographics | Rating | Rank | In Labor Force | Age 20-64 |
| British West Indians | 0.1 /100 | #265 | Tragic 78.4% |
| Bahamians | 0.1 /100 | #266 | Tragic 78.4% |
| U.S. Virgin Islanders | 0.1 /100 | #267 | Tragic 78.4% |
| West Indians | 0.0 /100 | #268 | Tragic 78.3% |
| Immigrants | Barbados | 0.0 /100 | #269 | Tragic 78.3% |
| Scotch-Irish | 0.0 /100 | #270 | Tragic 78.3% |
| Immigrants | Latin America | 0.0 /100 | #271 | Tragic 78.3% |
| Marshallese | 0.0 /100 | #272 | Tragic 78.3% |
| French American Indians | 0.0 /100 | #273 | Tragic 78.2% |
| Aleuts | 0.0 /100 | #274 | Tragic 78.2% |
| Spanish | 0.0 /100 | #275 | Tragic 78.2% |
| Puget Sound Salish | 0.0 /100 | #276 | Tragic 78.2% |
| Immigrants | Bahamas | 0.0 /100 | #277 | Tragic 78.2% |
| Mexican American Indians | 0.0 /100 | #278 | Tragic 78.2% |
| Belizeans | 0.0 /100 | #279 | Tragic 78.2% |
Demographics Similar to Alaskan Athabascans by In Labor Force | Age 20-64
In terms of in labor force | age 20-64, the demographic groups most similar to Alaskan Athabascans are Shoshone (76.8%, a difference of 0.12%), Black/African American (76.8%, a difference of 0.14%), Blackfeet (77.0%, a difference of 0.17%), Comanche (77.0%, a difference of 0.21%), and American (77.0%, a difference of 0.22%).
| Demographics | Rating | Rank | In Labor Force | Age 20-64 |
| Mexicans | 0.0 /100 | #305 | Tragic 77.2% |
| Potawatomi | 0.0 /100 | #306 | Tragic 77.2% |
| Central American Indians | 0.0 /100 | #307 | Tragic 77.1% |
| Alaska Natives | 0.0 /100 | #308 | Tragic 77.0% |
| Americans | 0.0 /100 | #309 | Tragic 77.0% |
| Comanche | 0.0 /100 | #310 | Tragic 77.0% |
| Blackfeet | 0.0 /100 | #311 | Tragic 77.0% |
| Alaskan Athabascans | 0.0 /100 | #312 | Tragic 76.9% |
| Shoshone | 0.0 /100 | #313 | Tragic 76.8% |
| Blacks/African Americans | 0.0 /100 | #314 | Tragic 76.8% |
| Ottawa | 0.0 /100 | #315 | Tragic 76.7% |
| Yaqui | 0.0 /100 | #316 | Tragic 76.5% |
| Cherokee | 0.0 /100 | #317 | Tragic 76.2% |
| Chickasaw | 0.0 /100 | #318 | Tragic 76.2% |
| Inupiat | 0.0 /100 | #319 | Tragic 76.1% |