Marshallese vs Immigrants from Western Africa In Labor Force | Age 16-19
COMPARE
Marshallese
Immigrants from Western Africa
In Labor Force | Age 16-19
In Labor Force | Age 16-19 Comparison
Marshallese
Immigrants from Western Africa
39.5%
IN LABOR FORCE | AGE 16-19
99.8/ 100
METRIC RATING
79th/ 347
METRIC RANK
36.9%
IN LABOR FORCE | AGE 16-19
66.7/ 100
METRIC RATING
166th/ 347
METRIC RANK
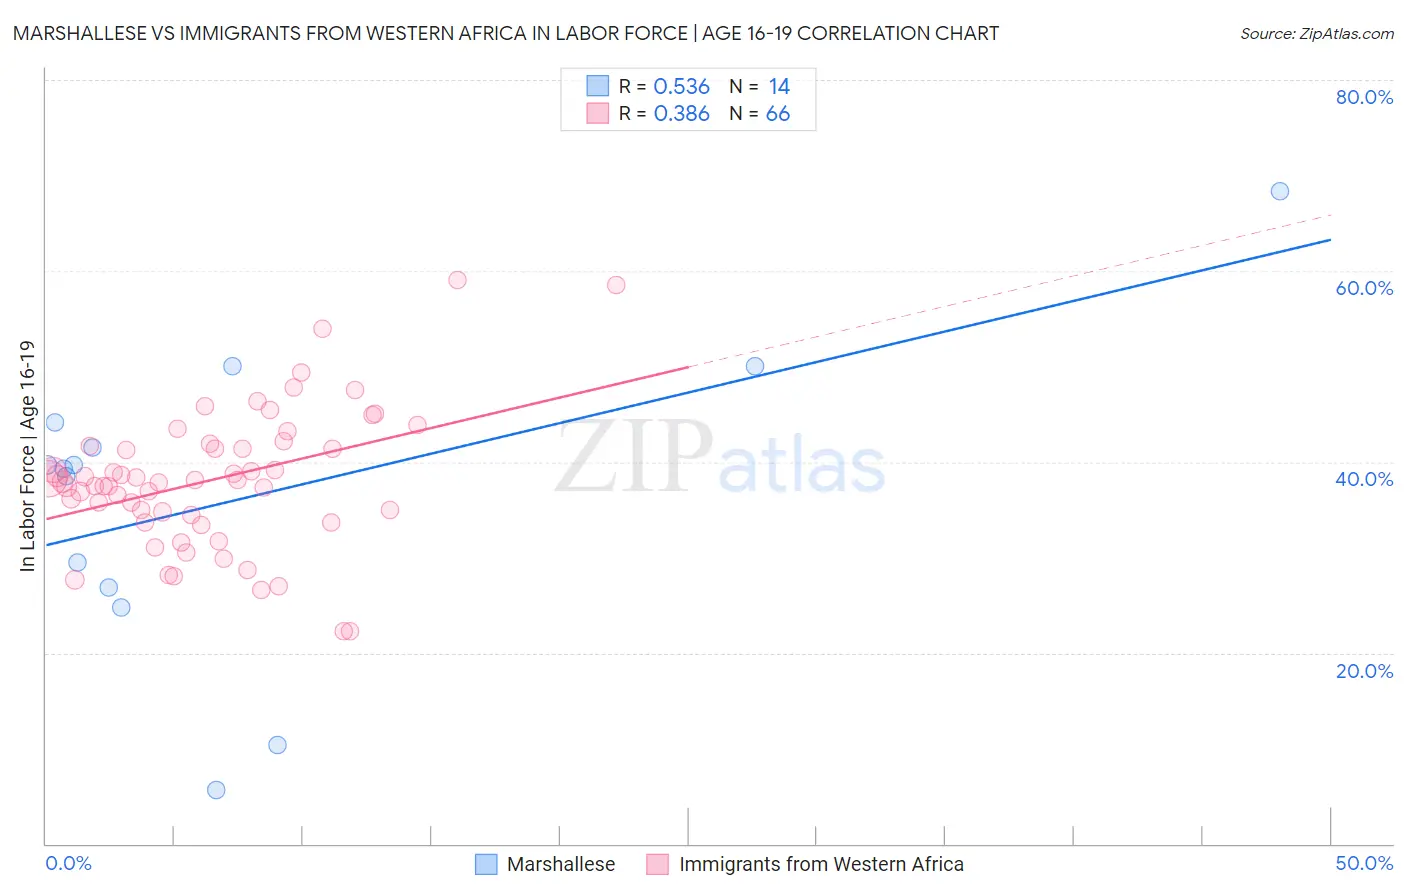
Marshallese vs Immigrants from Western Africa In Labor Force | Age 16-19 Correlation Chart
The statistical analysis conducted on geographies consisting of 14,757,218 people shows a substantial positive correlation between the proportion of Marshallese and labor force participation rate among population between the ages 16 and 19 in the United States with a correlation coefficient (R) of 0.536 and weighted average of 39.5%. Similarly, the statistical analysis conducted on geographies consisting of 357,569,133 people shows a mild positive correlation between the proportion of Immigrants from Western Africa and labor force participation rate among population between the ages 16 and 19 in the United States with a correlation coefficient (R) of 0.386 and weighted average of 36.9%, a difference of 7.0%.
In Labor Force | Age 16-19 Correlation Summary
| Measurement | Marshallese | Immigrants from Western Africa |
| Minimum | 5.6% | 22.2% |
| Maximum | 68.4% | 59.1% |
| Range | 62.8% | 36.9% |
| Mean | 36.3% | 38.1% |
| Median | 39.5% | 38.0% |
| Interquartile 25% (IQ1) | 26.8% | 34.4% |
| Interquartile 75% (IQ3) | 44.1% | 41.7% |
| Interquartile Range (IQR) | 17.3% | 7.3% |
| Standard Deviation (Sample) | 16.2% | 7.3% |
| Standard Deviation (Population) | 15.6% | 7.2% |
Similar Demographics by In Labor Force | Age 16-19
Demographics Similar to Marshallese by In Labor Force | Age 16-19
In terms of in labor force | age 16-19, the demographic groups most similar to Marshallese are Austrian (39.5%, a difference of 0.13%), Immigrants from Iraq (39.4%, a difference of 0.18%), Shoshone (39.3%, a difference of 0.46%), Immigrants from Portugal (39.7%, a difference of 0.52%), and Basque (39.3%, a difference of 0.52%).
| Demographics | Rating | Rank | In Labor Force | Age 16-19 |
| Iroquois | 99.9 /100 | #72 | Exceptional 39.9% |
| Immigrants | Middle Africa | 99.9 /100 | #73 | Exceptional 39.9% |
| Hungarians | 99.9 /100 | #74 | Exceptional 39.8% |
| French American Indians | 99.9 /100 | #75 | Exceptional 39.8% |
| Malaysians | 99.9 /100 | #76 | Exceptional 39.7% |
| Immigrants | Portugal | 99.9 /100 | #77 | Exceptional 39.7% |
| Austrians | 99.8 /100 | #78 | Exceptional 39.5% |
| Marshallese | 99.8 /100 | #79 | Exceptional 39.5% |
| Immigrants | Iraq | 99.8 /100 | #80 | Exceptional 39.4% |
| Shoshone | 99.7 /100 | #81 | Exceptional 39.3% |
| Basques | 99.7 /100 | #82 | Exceptional 39.3% |
| Spanish | 99.7 /100 | #83 | Exceptional 39.3% |
| Immigrants | Uganda | 99.7 /100 | #84 | Exceptional 39.2% |
| Creek | 99.6 /100 | #85 | Exceptional 39.1% |
| Samoans | 99.6 /100 | #86 | Exceptional 39.1% |
Demographics Similar to Immigrants from Western Africa by In Labor Force | Age 16-19
In terms of in labor force | age 16-19, the demographic groups most similar to Immigrants from Western Africa are Yakama (36.9%, a difference of 0.010%), Immigrants from Kuwait (36.9%, a difference of 0.12%), Bermudan (36.9%, a difference of 0.15%), Immigrants from Jordan (36.9%, a difference of 0.16%), and Arab (36.8%, a difference of 0.17%).
| Demographics | Rating | Rank | In Labor Force | Age 16-19 |
| Yaqui | 74.4 /100 | #159 | Good 37.1% |
| Immigrants | Saudi Arabia | 73.9 /100 | #160 | Good 37.0% |
| Cambodians | 71.5 /100 | #161 | Good 37.0% |
| Immigrants | Jordan | 69.5 /100 | #162 | Good 36.9% |
| Bermudans | 69.3 /100 | #163 | Good 36.9% |
| Immigrants | Kuwait | 68.9 /100 | #164 | Good 36.9% |
| Yakama | 66.9 /100 | #165 | Good 36.9% |
| Immigrants | Western Africa | 66.7 /100 | #166 | Good 36.9% |
| Arabs | 63.6 /100 | #167 | Good 36.8% |
| Palestinians | 63.1 /100 | #168 | Good 36.8% |
| Immigrants | Latvia | 61.6 /100 | #169 | Good 36.8% |
| Immigrants | South Africa | 60.5 /100 | #170 | Good 36.8% |
| Immigrants | Cambodia | 58.4 /100 | #171 | Average 36.7% |
| South Africans | 58.3 /100 | #172 | Average 36.7% |
| Russians | 57.5 /100 | #173 | Average 36.7% |