Malaysian vs Spanish 10th Grade
COMPARE
Malaysian
Spanish
10th Grade
10th Grade Comparison
Malaysians
Spanish
92.2%
10TH GRADE
0.1/ 100
METRIC RATING
280th/ 347
METRIC RANK
94.0%
10TH GRADE
74.9/ 100
METRIC RATING
155th/ 347
METRIC RANK
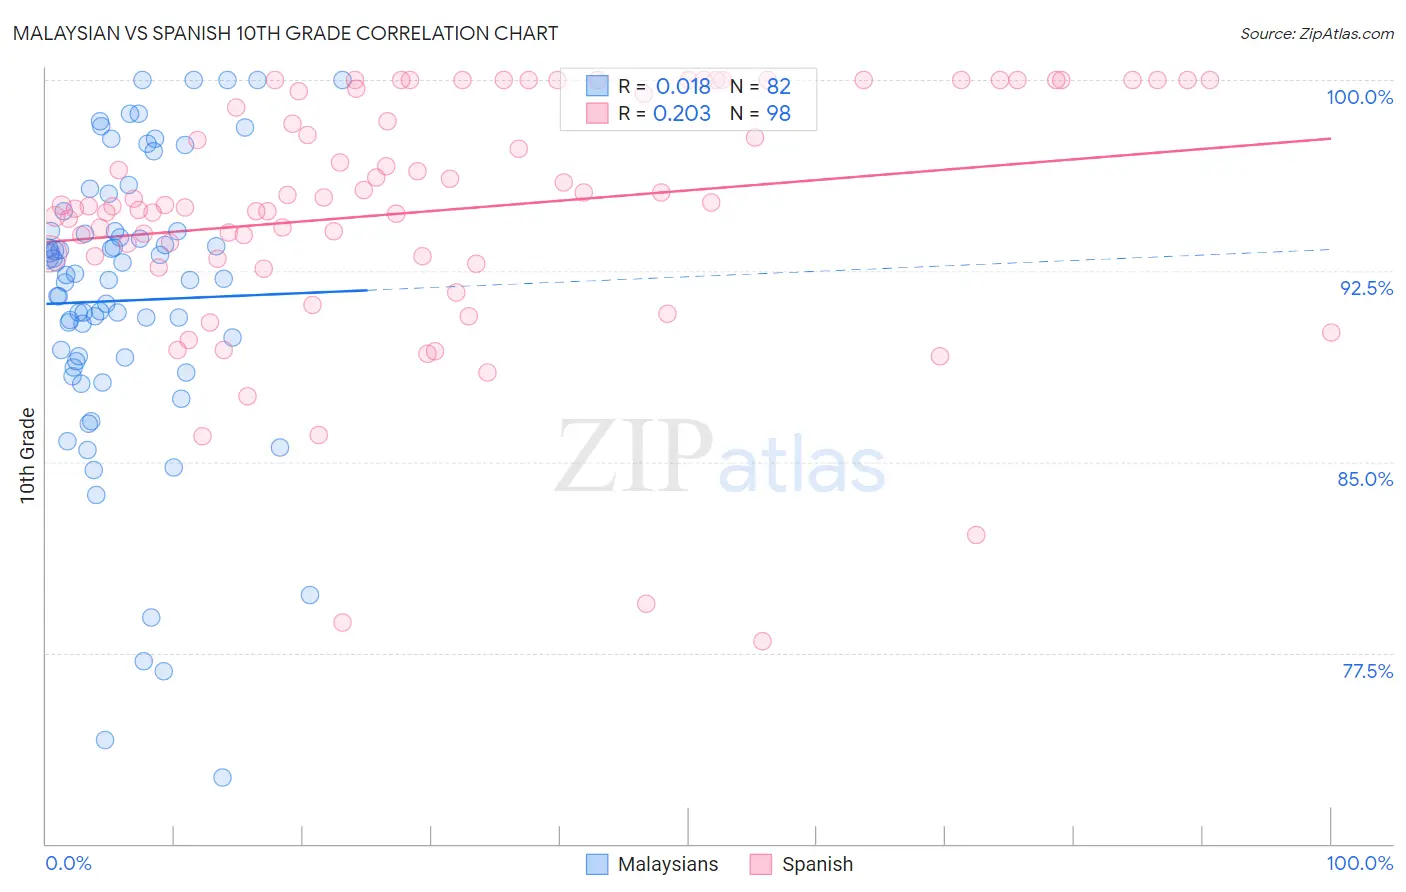
Malaysian vs Spanish 10th Grade Correlation Chart
The statistical analysis conducted on geographies consisting of 226,109,984 people shows no correlation between the proportion of Malaysians and percentage of population with at least 10th grade education in the United States with a correlation coefficient (R) of 0.018 and weighted average of 92.2%. Similarly, the statistical analysis conducted on geographies consisting of 422,189,188 people shows a weak positive correlation between the proportion of Spanish and percentage of population with at least 10th grade education in the United States with a correlation coefficient (R) of 0.203 and weighted average of 94.0%, a difference of 1.9%.
10th Grade Correlation Summary
| Measurement | Malaysian | Spanish |
| Minimum | 72.6% | 77.9% |
| Maximum | 100.0% | 100.0% |
| Range | 27.4% | 22.1% |
| Mean | 91.3% | 94.9% |
| Median | 92.2% | 95.1% |
| Interquartile 25% (IQ1) | 89.0% | 93.1% |
| Interquartile 75% (IQ3) | 94.1% | 99.7% |
| Interquartile Range (IQR) | 5.1% | 6.6% |
| Standard Deviation (Sample) | 5.8% | 4.9% |
| Standard Deviation (Population) | 5.7% | 4.8% |
Similar Demographics by 10th Grade
Demographics Similar to Malaysians by 10th Grade
In terms of 10th grade, the demographic groups most similar to Malaysians are Bangladeshi (92.2%, a difference of 0.010%), Native/Alaskan (92.2%, a difference of 0.030%), Immigrants from Peru (92.2%, a difference of 0.030%), Barbadian (92.2%, a difference of 0.040%), and Navajo (92.3%, a difference of 0.070%).
| Demographics | Rating | Rank | 10th Grade |
| Trinidadians and Tobagonians | 0.2 /100 | #273 | Tragic 92.4% |
| Immigrants | Congo | 0.2 /100 | #274 | Tragic 92.4% |
| West Indians | 0.2 /100 | #275 | Tragic 92.4% |
| Immigrants | Trinidad and Tobago | 0.1 /100 | #276 | Tragic 92.3% |
| Navajo | 0.1 /100 | #277 | Tragic 92.3% |
| Barbadians | 0.1 /100 | #278 | Tragic 92.2% |
| Natives/Alaskans | 0.1 /100 | #279 | Tragic 92.2% |
| Malaysians | 0.1 /100 | #280 | Tragic 92.2% |
| Bangladeshis | 0.1 /100 | #281 | Tragic 92.2% |
| Immigrants | Peru | 0.1 /100 | #282 | Tragic 92.2% |
| Immigrants | St. Vincent and the Grenadines | 0.0 /100 | #283 | Tragic 92.1% |
| Immigrants | Barbados | 0.0 /100 | #284 | Tragic 92.1% |
| Immigrants | South Eastern Asia | 0.0 /100 | #285 | Tragic 92.1% |
| Yuman | 0.0 /100 | #286 | Tragic 92.0% |
| Pennsylvania Germans | 0.0 /100 | #287 | Tragic 91.9% |
Demographics Similar to Spanish by 10th Grade
In terms of 10th grade, the demographic groups most similar to Spanish are Immigrants from Kenya (94.0%, a difference of 0.0%), Immigrants from Brazil (94.0%, a difference of 0.010%), Mongolian (94.0%, a difference of 0.010%), Kiowa (93.9%, a difference of 0.020%), and Immigrants from Italy (94.0%, a difference of 0.040%).
| Demographics | Rating | Rank | 10th Grade |
| Arabs | 80.9 /100 | #148 | Excellent 94.0% |
| Ugandans | 80.7 /100 | #149 | Excellent 94.0% |
| Egyptians | 79.6 /100 | #150 | Good 94.0% |
| Kenyans | 79.1 /100 | #151 | Good 94.0% |
| Immigrants | Italy | 78.0 /100 | #152 | Good 94.0% |
| Immigrants | Brazil | 75.5 /100 | #153 | Good 94.0% |
| Immigrants | Kenya | 75.3 /100 | #154 | Good 94.0% |
| Spanish | 74.9 /100 | #155 | Good 94.0% |
| Mongolians | 74.4 /100 | #156 | Good 94.0% |
| Kiowa | 73.3 /100 | #157 | Good 93.9% |
| Bermudans | 71.0 /100 | #158 | Good 93.9% |
| Chileans | 70.2 /100 | #159 | Good 93.9% |
| Pakistanis | 70.1 /100 | #160 | Good 93.9% |
| Assyrians/Chaldeans/Syriacs | 69.7 /100 | #161 | Good 93.9% |
| Immigrants | Poland | 69.6 /100 | #162 | Good 93.9% |