Malaysian vs Immigrants from St. Vincent and the Grenadines In Labor Force | Age 16-19

COMPARE

Malaysian
Race
Ancestry
AfghanAfricanAlaska NativeAlaskan AthabascanAlbanianAleutAlsatianAmericanApacheArabArapahoArgentineanArmenianAssyrian/Chaldean/SyriacAustralianAustrianBahamianBangladeshiBarbadianBasqueBelgianBelizeanBermudanBhutaneseBlackfeetBolivianBrazilianBritishBritish West IndianBulgarianBurmeseCajunCambodianCanadianCape VerdeanCarpatho RusynCelticCentral AmericanCentral American IndianCherokeeCheyenneChickasawChileanChineseChippewaChoctawColombianColvilleComancheCosta RicanCreeCreekCroatianCrowCubanCypriotCzechCzechoslovakianDanishDelawareDominicanDutchDutch West IndianEastern EuropeanEcuadorianEgyptianEnglishEstonianEthiopianEuropeanFijianFilipinoFinnishFrenchFrench American IndianFrench CanadianGermanGerman RussianGhanaianGreekGuamanian/ChamorroGuatemalanGuyaneseHaitianHmongHonduranHopiHoumaHungarianIcelanderIndian (Asian)IndonesianInupiatIranianIraqiIrishIroquoisIsraeliItalianJamaicanJapaneseJordanianKenyanKiowaKoreanLaotianLatvianLebaneseLiberianLithuanianLumbeeLuxembourgerMacedonianMalaysianMalteseMarshalleseMenomineeMexicanMexican American IndianMongolianMoroccanNative HawaiianNavajoNepaleseNew ZealanderNicaraguanNigerianNorthern EuropeanNorwegianOkinawanOsageOttawaPaiutePakistaniPalestinianPanamanianParaguayanPennsylvania GermanPeruvianPimaPolishPortuguesePotawatomiPuebloPuerto RicanPuget Sound SalishRomanianRussianSalvadoranSamoanScandinavianScotch-IrishScottishSeminoleSenegaleseSerbianShoshoneSierra LeoneanSiouxSlavicSlovakSloveneSomaliSouth AfricanSouth AmericanSouth American IndianSoviet UnionSpaniardSpanishSpanish AmericanSpanish American IndianSri LankanSubsaharan AfricanSudaneseSwedishSwissSyrianTaiwaneseThaiTlingit-HaidaTohono O'OdhamTonganTrinidadian and TobagonianTsimshianTurkishU.S. Virgin IslanderUgandanUkrainianUruguayanUteVenezuelanVietnameseWelshWest IndianYakamaYaquiYugoslavianYumanYup'ikZimbabwean
Immigration
NonimmigrantsImmigrantsAfghanistanAfricaAlbaniaArgentinaArmeniaAsiaAustraliaAustriaBahamasBangladeshBarbadosBelarusBelgiumBelizeBoliviaBosnia and HerzegovinaBrazilBulgariaBurma/MyanmarCabo VerdeCambodiaCameroonCanadaCaribbeanCentral AmericaChileChinaColombiaCongoCosta RicaCroatiaCubaCzechoslovakiaDenmarkDominicaDominican RepublicEastern AfricaEastern AsiaEastern EuropeEcuadorEgyptEl SalvadorEnglandEritreaEthiopiaEuropeFijiFranceGermanyGhanaGreeceGrenadaGuatemalaGuyanaHaitiHondurasHong KongHungaryIndiaIndonesiaIranIraqIrelandIsraelItalyJamaicaJapanJordanKazakhstanKenyaKoreaKuwaitLaosLatin AmericaLatviaLebanonLiberiaLithuaniaMalaysiaMexicoMicronesiaMiddle AfricaMoldovaMoroccoNepalNetherlandsNicaraguaNigeriaNorth AmericaNorth MacedoniaNorthern AfricaNorthern EuropeNorwayOceaniaPakistanPanamaPeruPhilippinesPolandPortugalRomaniaRussiaSaudi ArabiaScotlandSenegalSerbiaSierra LeoneSingaporeSomaliaSouth AfricaSouth AmericaSouth Central AsiaSouth Eastern AsiaSouthern EuropeSpainSri LankaSudanSwedenSwitzerlandSyriaTaiwanThailandTrinidad and TobagoTurkeyUgandaUkraineUruguayUzbekistanVenezuelaVietnamWest IndiesWestern AfricaWestern AsiaWestern EuropeYemenZaireZimbabweAzores
Immigrants from St. Vincent and the Grenadines
Race
Ancestry
AfghanAfricanAlaska NativeAlaskan AthabascanAlbanianAleutAlsatianAmericanApacheArabArapahoArgentineanArmenianAssyrian/Chaldean/SyriacAustralianAustrianBahamianBangladeshiBarbadianBasqueBelgianBelizeanBermudanBhutaneseBlackfeetBolivianBrazilianBritishBritish West IndianBulgarianBurmeseCajunCambodianCanadianCape VerdeanCarpatho RusynCelticCentral AmericanCentral American IndianCherokeeCheyenneChickasawChileanChineseChippewaChoctawColombianColvilleComancheCosta RicanCreeCreekCroatianCrowCubanCypriotCzechCzechoslovakianDanishDelawareDominicanDutchDutch West IndianEastern EuropeanEcuadorianEgyptianEnglishEstonianEthiopianEuropeanFijianFilipinoFinnishFrenchFrench American IndianFrench CanadianGermanGerman RussianGhanaianGreekGuamanian/ChamorroGuatemalanGuyaneseHaitianHmongHonduranHopiHoumaHungarianIcelanderIndian (Asian)IndonesianInupiatIranianIraqiIrishIroquoisIsraeliItalianJamaicanJapaneseJordanianKenyanKiowaKoreanLaotianLatvianLebaneseLiberianLithuanianLumbeeLuxembourgerMacedonianMalteseMarshalleseMenomineeMexicanMexican American IndianMongolianMoroccanNative HawaiianNavajoNepaleseNew ZealanderNicaraguanNigerianNorthern EuropeanNorwegianOkinawanOsageOttawaPaiutePakistaniPalestinianPanamanianParaguayanPennsylvania GermanPeruvianPimaPolishPortuguesePotawatomiPuebloPuerto RicanPuget Sound SalishRomanianRussianSalvadoranSamoanScandinavianScotch-IrishScottishSeminoleSenegaleseSerbianShoshoneSierra LeoneanSiouxSlavicSlovakSloveneSomaliSouth AfricanSouth AmericanSouth American IndianSoviet UnionSpaniardSpanishSpanish AmericanSpanish American IndianSri LankanSubsaharan AfricanSudaneseSwedishSwissSyrianTaiwaneseThaiTlingit-HaidaTohono O'OdhamTonganTrinidadian and TobagonianTsimshianTurkishU.S. Virgin IslanderUgandanUkrainianUruguayanUteVenezuelanVietnameseWelshWest IndianYakamaYaquiYugoslavianYumanYup'ikZimbabwean
Immigration
NonimmigrantsImmigrantsAfghanistanAfricaAlbaniaArgentinaArmeniaAsiaAustraliaAustriaBahamasBangladeshBarbadosBelarusBelgiumBelizeBoliviaBosnia and HerzegovinaBrazilBulgariaBurma/MyanmarCabo VerdeCambodiaCameroonCanadaCaribbeanCentral AmericaChileChinaColombiaCongoCosta RicaCroatiaCubaCzechoslovakiaDenmarkDominicaDominican RepublicEastern AfricaEastern AsiaEastern EuropeEcuadorEgyptEl SalvadorEnglandEritreaEthiopiaEuropeFijiFranceGermanyGhanaGreeceGrenadaGuatemalaGuyanaHaitiHondurasHong KongHungaryIndiaIndonesiaIranIraqIrelandIsraelItalyJamaicaJapanJordanKazakhstanKenyaKoreaKuwaitLaosLatin AmericaLatviaLebanonLiberiaLithuaniaMalaysiaMexicoMicronesiaMiddle AfricaMoldovaMoroccoNepalNetherlandsNicaraguaNigeriaNorth AmericaNorth MacedoniaNorthern AfricaNorthern EuropeNorwayOceaniaPakistanPanamaPeruPhilippinesPolandPortugalRomaniaRussiaSaudi ArabiaScotlandSenegalSerbiaSierra LeoneSingaporeSomaliaSouth AfricaSouth AmericaSouth Central AsiaSouth Eastern AsiaSouthern EuropeSpainSri LankaSt. Vincent and the GrenadinesSudanSwedenSwitzerlandSyriaTaiwanThailandTrinidad and TobagoTurkeyUgandaUkraineUruguayUzbekistanVenezuelaVietnamWest IndiesWestern AfricaWestern AsiaWestern EuropeYemenZaireZimbabweAzores
In Labor Force | Age 16-19
Income
Poverty
Unemployment
Labor Participation
Family Structure
Vehicle Availability
Education Level
Disability

In Labor Force | Age 16-19 Comparison

Malaysians

Immigrants from St. Vincent and the Grenadines

Exceptional
Tragic
39.7%
IN LABOR FORCE | AGE 16-19
99.9/ 100
METRIC RATING
76th/ 347
METRIC RANK
26.3%
IN LABOR FORCE | AGE 16-19
0.0/ 100
METRIC RATING
346th/ 347
METRIC RANK

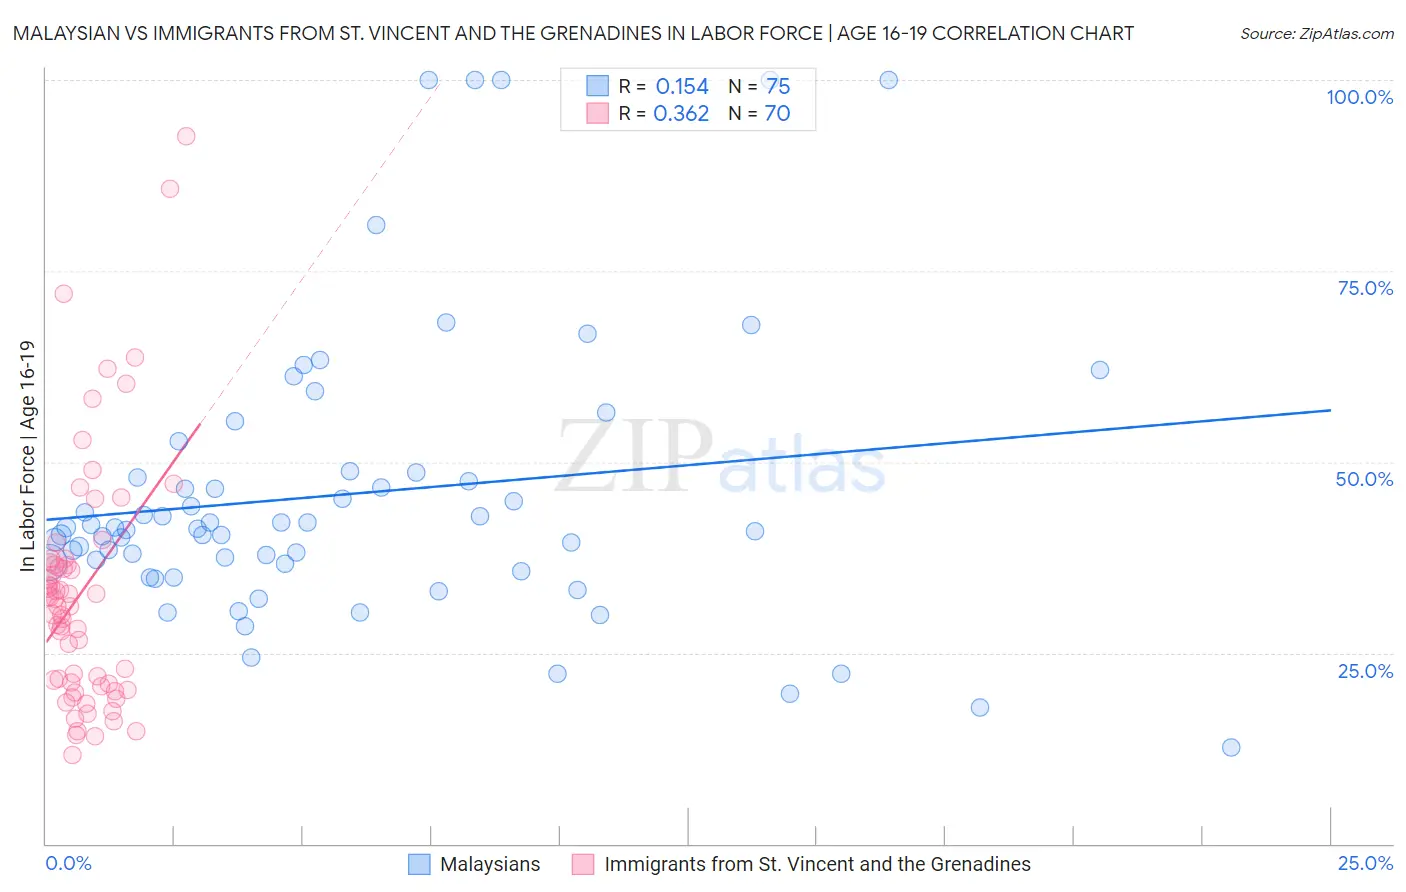
Malaysian vs Immigrants from St. Vincent and the Grenadines In Labor Force | Age 16-19 Correlation Chart

The statistical analysis conducted on geographies consisting of 225,967,692 people shows a poor positive correlation between the proportion of Malaysians and labor force participation rate among population between the ages 16 and 19 in the United States with a correlation coefficient (R) of 0.154 and weighted average of 39.7%. Similarly, the statistical analysis conducted on geographies consisting of 56,187,871 people shows a mild positive correlation between the proportion of Immigrants from St. Vincent and the Grenadines and labor force participation rate among population between the ages 16 and 19 in the United States with a correlation coefficient (R) of 0.362 and weighted average of 26.3%, a difference of 51.3%.
Malaysian vs Immigrants from St. Vincent and the Grenadines In Labor Force | Age 16-19

In Labor Force | Age 16-19 Correlation Summary

MeasurementMalaysianImmigrants from St. Vincent and the Grenadines
Minimum12.6%11.7%
Maximum100.0%92.7%
Range87.4%81.0%
Mean45.8%33.1%
Median41.3%31.6%
Interquartile 25% (IQ1)36.7%20.9%
Interquartile 75% (IQ3)48.6%36.9%
Interquartile Range (IQR)11.9%16.0%
Standard Deviation (Sample)18.9%16.2%
Standard Deviation (Population)18.8%16.1%

Similar Demographics by In Labor Force | Age 16-19

Demographics Similar to Malaysians by In Labor Force | Age 16-19

In terms of in labor force | age 16-19, the demographic groups most similar to Malaysians are Immigrants from Portugal (39.7%, a difference of 0.13%), French American Indian (39.8%, a difference of 0.27%), Hungarian (39.8%, a difference of 0.29%), Immigrants from Middle Africa (39.9%, a difference of 0.52%), and Austrian (39.5%, a difference of 0.52%).
DemographicsRating | RankIn Labor Force | Age 16-19
Potawatomi
99.9
/100
|
#69
Exceptional
40.0%
Portuguese
99.9
/100
|
#70
Exceptional
40.0%
Serbians
99.9
/100
|
#71
Exceptional
39.9%
Iroquois
99.9
/100
|
#72
Exceptional
39.9%
Immigrants | Middle Africa
99.9
/100
|
#73
Exceptional
39.9%
Hungarians
99.9
/100
|
#74
Exceptional
39.8%
French American Indians
99.9
/100
|
#75
Exceptional
39.8%
Malaysians
99.9
/100
|
#76
Exceptional
39.7%
Immigrants | Portugal
99.9
/100
|
#77
Exceptional
39.7%
Austrians
99.8
/100
|
#78
Exceptional
39.5%
Marshallese
99.8
/100
|
#79
Exceptional
39.5%
Immigrants | Iraq
99.8
/100
|
#80
Exceptional
39.4%
Shoshone
99.7
/100
|
#81
Exceptional
39.3%
Basques
99.7
/100
|
#82
Exceptional
39.3%
Spanish
99.7
/100
|
#83
Exceptional
39.3%

Demographics Similar to Immigrants from St. Vincent and the Grenadines by In Labor Force | Age 16-19

In terms of in labor force | age 16-19, the demographic groups most similar to Immigrants from St. Vincent and the Grenadines are Immigrants from Grenada (25.4%, a difference of 3.4%), Immigrants from Guyana (27.3%, a difference of 3.9%), Guyanese (27.4%, a difference of 4.5%), Yuman (27.7%, a difference of 5.3%), and Immigrants from Barbados (29.0%, a difference of 10.4%).
DemographicsRating | RankIn Labor Force | Age 16-19
Immigrants | Hong Kong
0.0
/100
|
#333
Tragic
30.5%
Puerto Ricans
0.0
/100
|
#334
Tragic
30.3%
Immigrants | Cuba
0.0
/100
|
#335
Tragic
30.2%
Immigrants | Trinidad and Tobago
0.0
/100
|
#336
Tragic
30.2%
Immigrants | Bangladesh
0.0
/100
|
#337
Tragic
30.0%
Vietnamese
0.0
/100
|
#338
Tragic
29.6%
Immigrants | Uzbekistan
0.0
/100
|
#339
Tragic
29.2%
British West Indians
0.0
/100
|
#340
Tragic
29.1%
Immigrants | Armenia
0.0
/100
|
#341
Tragic
29.0%
Immigrants | Barbados
0.0
/100
|
#342
Tragic
29.0%
Yuman
0.0
/100
|
#343
Tragic
27.7%
Guyanese
0.0
/100
|
#344
Tragic
27.4%
Immigrants | Guyana
0.0
/100
|
#345
Tragic
27.3%
Immigrants | St. Vincent and the Grenadines
0.0
/100
|
#346
Tragic
26.3%
Immigrants | Grenada
0.0
/100
|
#347
Tragic
25.4%