Immigrants from Micronesia vs Immigrants from Moldova In Labor Force | Age 16-19
COMPARE
Immigrants from Micronesia
Immigrants from Moldova
In Labor Force | Age 16-19
In Labor Force | Age 16-19 Comparison
Immigrants from Micronesia
Immigrants from Moldova
40.2%
IN LABOR FORCE | AGE 16-19
100.0/ 100
METRIC RATING
64th/ 347
METRIC RANK
37.7%
IN LABOR FORCE | AGE 16-19
91.9/ 100
METRIC RATING
139th/ 347
METRIC RANK
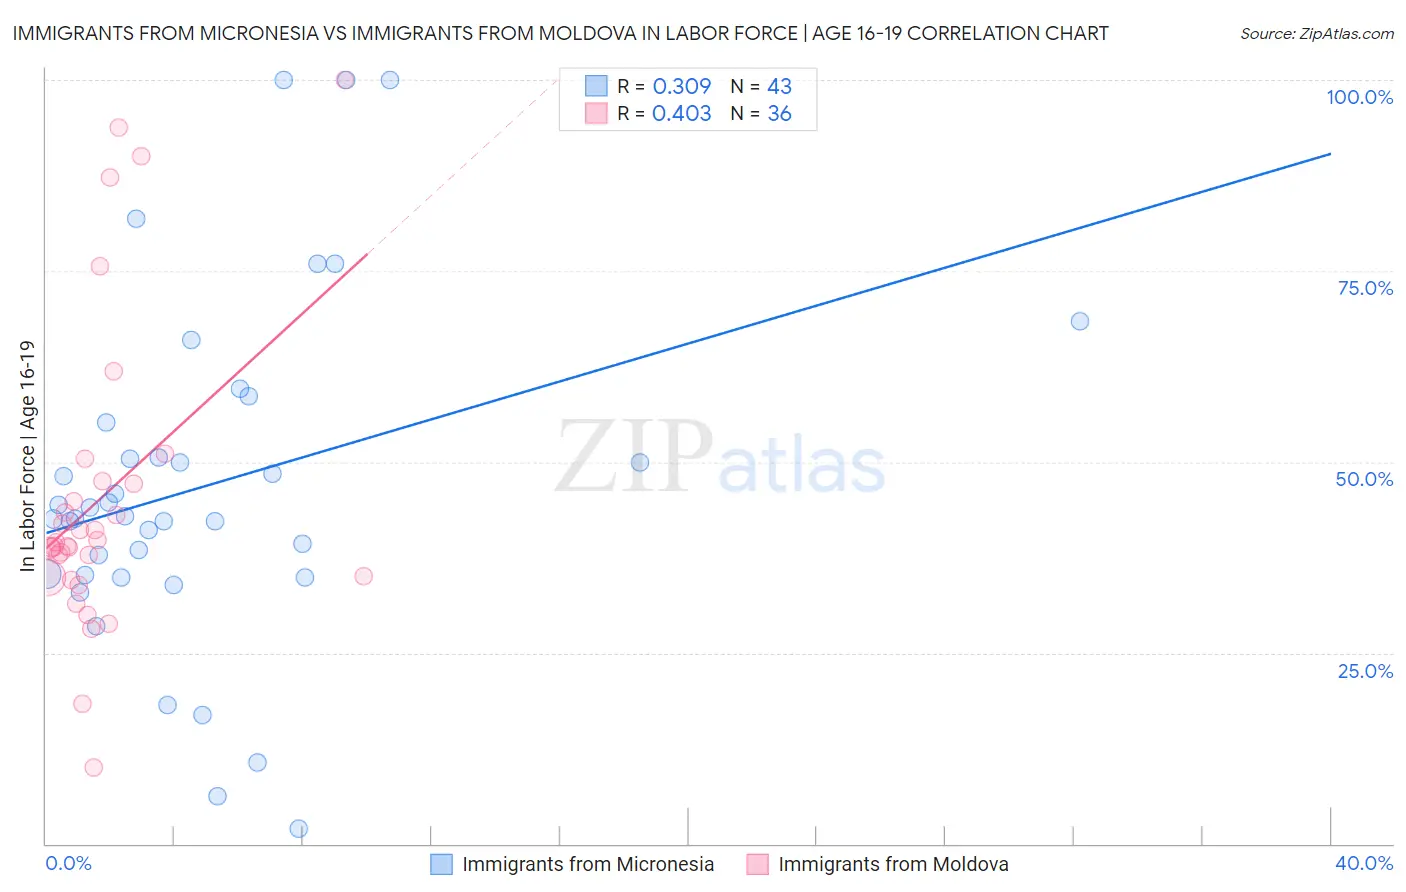
Immigrants from Micronesia vs Immigrants from Moldova In Labor Force | Age 16-19 Correlation Chart
The statistical analysis conducted on geographies consisting of 61,545,841 people shows a mild positive correlation between the proportion of Immigrants from Micronesia and labor force participation rate among population between the ages 16 and 19 in the United States with a correlation coefficient (R) of 0.309 and weighted average of 40.2%. Similarly, the statistical analysis conducted on geographies consisting of 124,314,308 people shows a moderate positive correlation between the proportion of Immigrants from Moldova and labor force participation rate among population between the ages 16 and 19 in the United States with a correlation coefficient (R) of 0.403 and weighted average of 37.7%, a difference of 6.6%.
In Labor Force | Age 16-19 Correlation Summary
| Measurement | Immigrants from Micronesia | Immigrants from Moldova |
| Minimum | 1.9% | 10.0% |
| Maximum | 100.0% | 100.0% |
| Range | 98.1% | 90.0% |
| Mean | 46.9% | 45.3% |
| Median | 42.9% | 39.2% |
| Interquartile 25% (IQ1) | 35.2% | 34.9% |
| Interquartile 75% (IQ3) | 55.2% | 47.3% |
| Interquartile Range (IQR) | 20.0% | 12.4% |
| Standard Deviation (Sample) | 22.3% | 20.2% |
| Standard Deviation (Population) | 22.1% | 19.9% |
Similar Demographics by In Labor Force | Age 16-19
Demographics Similar to Immigrants from Micronesia by In Labor Force | Age 16-19
In terms of in labor force | age 16-19, the demographic groups most similar to Immigrants from Micronesia are Kenyan (40.1%, a difference of 0.080%), Northern European (40.2%, a difference of 0.12%), Cherokee (40.2%, a difference of 0.17%), Nonimmigrants (40.1%, a difference of 0.20%), and Canadian (40.1%, a difference of 0.21%).
| Demographics | Rating | Rank | In Labor Force | Age 16-19 |
| Lithuanians | 100.0 /100 | #57 | Exceptional 40.4% |
| Aleuts | 100.0 /100 | #58 | Exceptional 40.4% |
| Slavs | 100.0 /100 | #59 | Exceptional 40.4% |
| Immigrants | Eastern Africa | 100.0 /100 | #60 | Exceptional 40.4% |
| Americans | 100.0 /100 | #61 | Exceptional 40.3% |
| Cherokee | 100.0 /100 | #62 | Exceptional 40.2% |
| Northern Europeans | 100.0 /100 | #63 | Exceptional 40.2% |
| Immigrants | Micronesia | 100.0 /100 | #64 | Exceptional 40.2% |
| Kenyans | 100.0 /100 | #65 | Exceptional 40.1% |
| Immigrants | Nonimmigrants | 100.0 /100 | #66 | Exceptional 40.1% |
| Canadians | 100.0 /100 | #67 | Exceptional 40.1% |
| Italians | 99.9 /100 | #68 | Exceptional 40.1% |
| Potawatomi | 99.9 /100 | #69 | Exceptional 40.0% |
| Portuguese | 99.9 /100 | #70 | Exceptional 40.0% |
| Serbians | 99.9 /100 | #71 | Exceptional 39.9% |
Demographics Similar to Immigrants from Moldova by In Labor Force | Age 16-19
In terms of in labor force | age 16-19, the demographic groups most similar to Immigrants from Moldova are Comanche (37.7%, a difference of 0.010%), Estonian (37.7%, a difference of 0.030%), Syrian (37.6%, a difference of 0.17%), Australian (37.8%, a difference of 0.24%), and Cajun (37.8%, a difference of 0.24%).
| Demographics | Rating | Rank | In Labor Force | Age 16-19 |
| Immigrants | Oceania | 94.7 /100 | #132 | Exceptional 37.9% |
| Cheyenne | 94.6 /100 | #133 | Exceptional 37.9% |
| Immigrants | Netherlands | 93.7 /100 | #134 | Exceptional 37.8% |
| Macedonians | 93.4 /100 | #135 | Exceptional 37.8% |
| Australians | 93.2 /100 | #136 | Exceptional 37.8% |
| Cajuns | 93.2 /100 | #137 | Exceptional 37.8% |
| Comanche | 91.9 /100 | #138 | Exceptional 37.7% |
| Immigrants | Moldova | 91.9 /100 | #139 | Exceptional 37.7% |
| Estonians | 91.7 /100 | #140 | Exceptional 37.7% |
| Syrians | 90.7 /100 | #141 | Exceptional 37.6% |
| Sierra Leoneans | 89.7 /100 | #142 | Excellent 37.6% |
| Pakistanis | 89.5 /100 | #143 | Excellent 37.6% |
| Japanese | 89.3 /100 | #144 | Excellent 37.5% |
| Paiute | 89.3 /100 | #145 | Excellent 37.5% |
| Immigrants | Western Europe | 88.9 /100 | #146 | Excellent 37.5% |