Malaysian vs Immigrants from Cambodia In Labor Force | Age 16-19
COMPARE
Malaysian
Immigrants from Cambodia
In Labor Force | Age 16-19
In Labor Force | Age 16-19 Comparison
Malaysians
Immigrants from Cambodia
39.7%
IN LABOR FORCE | AGE 16-19
99.9/ 100
METRIC RATING
76th/ 347
METRIC RANK
36.7%
IN LABOR FORCE | AGE 16-19
58.4/ 100
METRIC RATING
171st/ 347
METRIC RANK
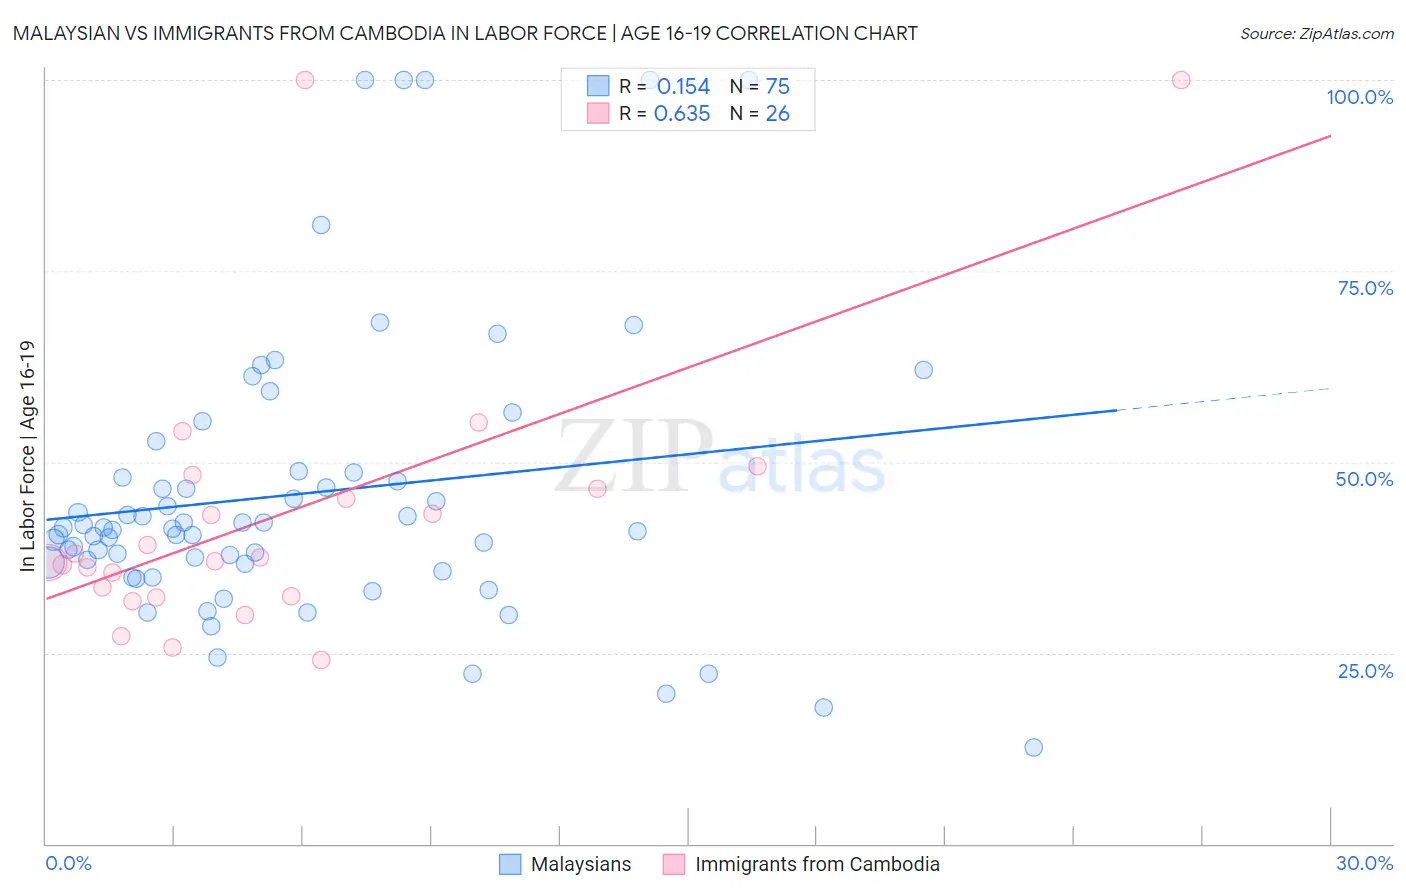
Malaysian vs Immigrants from Cambodia In Labor Force | Age 16-19 Correlation Chart
The statistical analysis conducted on geographies consisting of 225,967,692 people shows a poor positive correlation between the proportion of Malaysians and labor force participation rate among population between the ages 16 and 19 in the United States with a correlation coefficient (R) of 0.154 and weighted average of 39.7%. Similarly, the statistical analysis conducted on geographies consisting of 205,098,821 people shows a significant positive correlation between the proportion of Immigrants from Cambodia and labor force participation rate among population between the ages 16 and 19 in the United States with a correlation coefficient (R) of 0.635 and weighted average of 36.7%, a difference of 8.2%.
In Labor Force | Age 16-19 Correlation Summary
| Measurement | Malaysian | Immigrants from Cambodia |
| Minimum | 12.6% | 24.1% |
| Maximum | 100.0% | 100.0% |
| Range | 87.4% | 75.9% |
| Mean | 45.8% | 43.0% |
| Median | 41.3% | 37.2% |
| Interquartile 25% (IQ1) | 36.7% | 32.5% |
| Interquartile 75% (IQ3) | 48.6% | 46.4% |
| Interquartile Range (IQR) | 11.9% | 13.9% |
| Standard Deviation (Sample) | 18.9% | 18.6% |
| Standard Deviation (Population) | 18.8% | 18.3% |
Similar Demographics by In Labor Force | Age 16-19
Demographics Similar to Malaysians by In Labor Force | Age 16-19
In terms of in labor force | age 16-19, the demographic groups most similar to Malaysians are Immigrants from Portugal (39.7%, a difference of 0.13%), French American Indian (39.8%, a difference of 0.27%), Hungarian (39.8%, a difference of 0.29%), Immigrants from Middle Africa (39.9%, a difference of 0.52%), and Austrian (39.5%, a difference of 0.52%).
| Demographics | Rating | Rank | In Labor Force | Age 16-19 |
| Potawatomi | 99.9 /100 | #69 | Exceptional 40.0% |
| Portuguese | 99.9 /100 | #70 | Exceptional 40.0% |
| Serbians | 99.9 /100 | #71 | Exceptional 39.9% |
| Iroquois | 99.9 /100 | #72 | Exceptional 39.9% |
| Immigrants | Middle Africa | 99.9 /100 | #73 | Exceptional 39.9% |
| Hungarians | 99.9 /100 | #74 | Exceptional 39.8% |
| French American Indians | 99.9 /100 | #75 | Exceptional 39.8% |
| Malaysians | 99.9 /100 | #76 | Exceptional 39.7% |
| Immigrants | Portugal | 99.9 /100 | #77 | Exceptional 39.7% |
| Austrians | 99.8 /100 | #78 | Exceptional 39.5% |
| Marshallese | 99.8 /100 | #79 | Exceptional 39.5% |
| Immigrants | Iraq | 99.8 /100 | #80 | Exceptional 39.4% |
| Shoshone | 99.7 /100 | #81 | Exceptional 39.3% |
| Basques | 99.7 /100 | #82 | Exceptional 39.3% |
| Spanish | 99.7 /100 | #83 | Exceptional 39.3% |
Demographics Similar to Immigrants from Cambodia by In Labor Force | Age 16-19
In terms of in labor force | age 16-19, the demographic groups most similar to Immigrants from Cambodia are South African (36.7%, a difference of 0.010%), Russian (36.7%, a difference of 0.040%), Immigrants from South Africa (36.8%, a difference of 0.11%), Immigrants from Latvia (36.8%, a difference of 0.17%), and Palestinian (36.8%, a difference of 0.25%).
| Demographics | Rating | Rank | In Labor Force | Age 16-19 |
| Immigrants | Kuwait | 68.9 /100 | #164 | Good 36.9% |
| Yakama | 66.9 /100 | #165 | Good 36.9% |
| Immigrants | Western Africa | 66.7 /100 | #166 | Good 36.9% |
| Arabs | 63.6 /100 | #167 | Good 36.8% |
| Palestinians | 63.1 /100 | #168 | Good 36.8% |
| Immigrants | Latvia | 61.6 /100 | #169 | Good 36.8% |
| Immigrants | South Africa | 60.5 /100 | #170 | Good 36.8% |
| Immigrants | Cambodia | 58.4 /100 | #171 | Average 36.7% |
| South Africans | 58.3 /100 | #172 | Average 36.7% |
| Russians | 57.5 /100 | #173 | Average 36.7% |
| Immigrants | Czechoslovakia | 50.0 /100 | #174 | Average 36.6% |
| Natives/Alaskans | 49.0 /100 | #175 | Average 36.6% |
| Albanians | 48.8 /100 | #176 | Average 36.5% |
| Immigrants | Northern Europe | 46.6 /100 | #177 | Average 36.5% |
| Blacks/African Americans | 45.1 /100 | #178 | Average 36.5% |