Macedonian vs American In Labor Force | Age 30-34
COMPARE
Macedonian
American
In Labor Force | Age 30-34
In Labor Force | Age 30-34 Comparison
Macedonians
Americans
85.5%
IN LABOR FORCE | AGE 30-34
99.4/ 100
METRIC RATING
63rd/ 347
METRIC RANK
82.7%
IN LABOR FORCE | AGE 30-34
0.0/ 100
METRIC RATING
294th/ 347
METRIC RANK
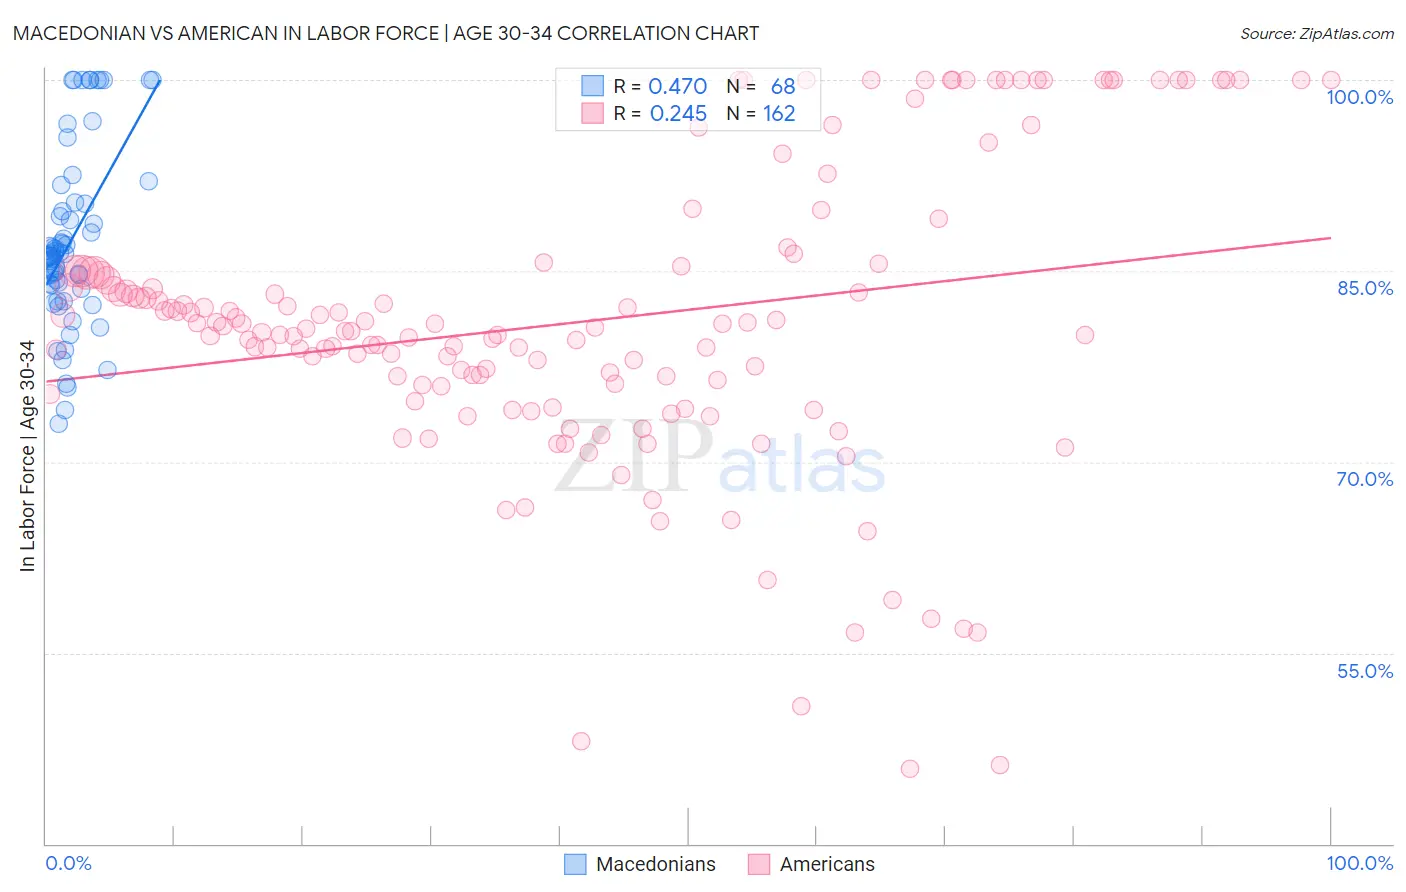
Macedonian vs American In Labor Force | Age 30-34 Correlation Chart
The statistical analysis conducted on geographies consisting of 132,641,832 people shows a moderate positive correlation between the proportion of Macedonians and labor force participation rate among population between the ages 30 and 34 in the United States with a correlation coefficient (R) of 0.470 and weighted average of 85.5%. Similarly, the statistical analysis conducted on geographies consisting of 580,133,511 people shows a weak positive correlation between the proportion of Americans and labor force participation rate among population between the ages 30 and 34 in the United States with a correlation coefficient (R) of 0.245 and weighted average of 82.7%, a difference of 3.3%.
In Labor Force | Age 30-34 Correlation Summary
| Measurement | Macedonian | American |
| Minimum | 73.0% | 45.9% |
| Maximum | 100.0% | 100.0% |
| Range | 27.0% | 54.1% |
| Mean | 87.4% | 81.0% |
| Median | 86.3% | 80.4% |
| Interquartile 25% (IQ1) | 83.8% | 75.9% |
| Interquartile 75% (IQ3) | 90.3% | 85.0% |
| Interquartile Range (IQR) | 6.5% | 9.0% |
| Standard Deviation (Sample) | 7.0% | 11.6% |
| Standard Deviation (Population) | 7.0% | 11.6% |
Similar Demographics by In Labor Force | Age 30-34
Demographics Similar to Macedonians by In Labor Force | Age 30-34
In terms of in labor force | age 30-34, the demographic groups most similar to Macedonians are Soviet Union (85.5%, a difference of 0.0%), Immigrants from France (85.5%, a difference of 0.010%), Immigrants from Brazil (85.5%, a difference of 0.010%), Italian (85.4%, a difference of 0.010%), and Senegalese (85.4%, a difference of 0.010%).
| Demographics | Rating | Rank | In Labor Force | Age 30-34 |
| Czechs | 99.6 /100 | #56 | Exceptional 85.5% |
| Russians | 99.6 /100 | #57 | Exceptional 85.5% |
| Poles | 99.6 /100 | #58 | Exceptional 85.5% |
| Immigrants | Poland | 99.5 /100 | #59 | Exceptional 85.5% |
| Immigrants | France | 99.5 /100 | #60 | Exceptional 85.5% |
| Immigrants | Brazil | 99.5 /100 | #61 | Exceptional 85.5% |
| Soviet Union | 99.4 /100 | #62 | Exceptional 85.5% |
| Macedonians | 99.4 /100 | #63 | Exceptional 85.5% |
| Italians | 99.4 /100 | #64 | Exceptional 85.4% |
| Senegalese | 99.4 /100 | #65 | Exceptional 85.4% |
| Ghanaians | 99.4 /100 | #66 | Exceptional 85.4% |
| Kenyans | 99.3 /100 | #67 | Exceptional 85.4% |
| Immigrants | Eastern Europe | 99.3 /100 | #68 | Exceptional 85.4% |
| Immigrants | Iran | 99.2 /100 | #69 | Exceptional 85.4% |
| Brazilians | 99.1 /100 | #70 | Exceptional 85.4% |
Demographics Similar to Americans by In Labor Force | Age 30-34
In terms of in labor force | age 30-34, the demographic groups most similar to Americans are Nepalese (82.7%, a difference of 0.020%), Black/African American (82.8%, a difference of 0.090%), Potawatomi (82.8%, a difference of 0.11%), Pennsylvania German (82.6%, a difference of 0.12%), and Blackfeet (82.8%, a difference of 0.13%).
| Demographics | Rating | Rank | In Labor Force | Age 30-34 |
| Native Hawaiians | 0.0 /100 | #287 | Tragic 83.0% |
| Central American Indians | 0.0 /100 | #288 | Tragic 83.0% |
| Hawaiians | 0.0 /100 | #289 | Tragic 83.0% |
| Blackfeet | 0.0 /100 | #290 | Tragic 82.8% |
| Potawatomi | 0.0 /100 | #291 | Tragic 82.8% |
| Blacks/African Americans | 0.0 /100 | #292 | Tragic 82.8% |
| Nepalese | 0.0 /100 | #293 | Tragic 82.7% |
| Americans | 0.0 /100 | #294 | Tragic 82.7% |
| Pennsylvania Germans | 0.0 /100 | #295 | Tragic 82.6% |
| Chippewa | 0.0 /100 | #296 | Tragic 82.6% |
| Comanche | 0.0 /100 | #297 | Tragic 82.6% |
| Aleuts | 0.0 /100 | #298 | Tragic 82.6% |
| Immigrants | Central America | 0.0 /100 | #299 | Tragic 82.5% |
| Hmong | 0.0 /100 | #300 | Tragic 82.4% |
| Hispanics or Latinos | 0.0 /100 | #301 | Tragic 82.4% |