Israeli vs Dutch In Labor Force | Age 16-19
COMPARE
Israeli
Dutch
In Labor Force | Age 16-19
In Labor Force | Age 16-19 Comparison
Israelis
Dutch
32.4%
IN LABOR FORCE | AGE 16-19
0.0/ 100
METRIC RATING
304th/ 347
METRIC RANK
43.8%
IN LABOR FORCE | AGE 16-19
100.0/ 100
METRIC RATING
13th/ 347
METRIC RANK
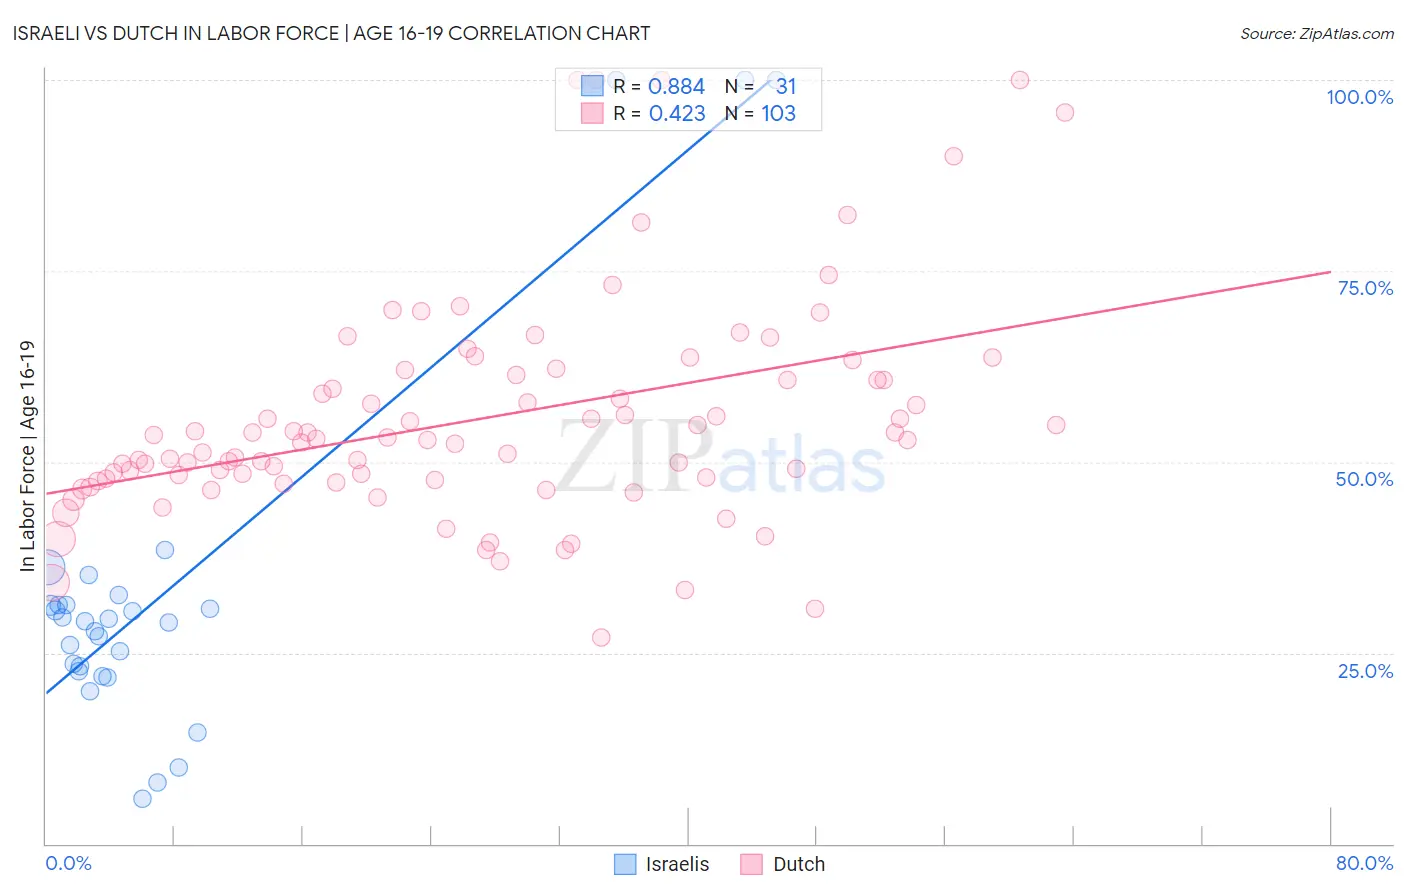
Israeli vs Dutch In Labor Force | Age 16-19 Correlation Chart
The statistical analysis conducted on geographies consisting of 210,873,555 people shows a very strong positive correlation between the proportion of Israelis and labor force participation rate among population between the ages 16 and 19 in the United States with a correlation coefficient (R) of 0.884 and weighted average of 32.4%. Similarly, the statistical analysis conducted on geographies consisting of 550,994,528 people shows a moderate positive correlation between the proportion of Dutch and labor force participation rate among population between the ages 16 and 19 in the United States with a correlation coefficient (R) of 0.423 and weighted average of 43.8%, a difference of 35.3%.
In Labor Force | Age 16-19 Correlation Summary
| Measurement | Israeli | Dutch |
| Minimum | 5.9% | 27.0% |
| Maximum | 100.0% | 100.0% |
| Range | 94.1% | 73.0% |
| Mean | 33.0% | 55.7% |
| Median | 29.1% | 52.9% |
| Interquartile 25% (IQ1) | 22.6% | 47.7% |
| Interquartile 75% (IQ3) | 31.3% | 61.4% |
| Interquartile Range (IQR) | 8.8% | 13.7% |
| Standard Deviation (Sample) | 23.6% | 14.5% |
| Standard Deviation (Population) | 23.2% | 14.4% |
Similar Demographics by In Labor Force | Age 16-19
Demographics Similar to Israelis by In Labor Force | Age 16-19
In terms of in labor force | age 16-19, the demographic groups most similar to Israelis are Nicaraguan (32.4%, a difference of 0.050%), Spanish American Indian (32.4%, a difference of 0.18%), Immigrants from Dominica (32.5%, a difference of 0.19%), Immigrants from Jamaica (32.2%, a difference of 0.67%), and Navajo (32.1%, a difference of 1.0%).
| Demographics | Rating | Rank | In Labor Force | Age 16-19 |
| Immigrants | Haiti | 0.1 /100 | #297 | Tragic 33.2% |
| Iranians | 0.0 /100 | #298 | Tragic 33.0% |
| Armenians | 0.0 /100 | #299 | Tragic 32.9% |
| Immigrants | Argentina | 0.0 /100 | #300 | Tragic 32.9% |
| Okinawans | 0.0 /100 | #301 | Tragic 32.8% |
| Belizeans | 0.0 /100 | #302 | Tragic 32.8% |
| Immigrants | Dominica | 0.0 /100 | #303 | Tragic 32.5% |
| Israelis | 0.0 /100 | #304 | Tragic 32.4% |
| Nicaraguans | 0.0 /100 | #305 | Tragic 32.4% |
| Spanish American Indians | 0.0 /100 | #306 | Tragic 32.4% |
| Immigrants | Jamaica | 0.0 /100 | #307 | Tragic 32.2% |
| Navajo | 0.0 /100 | #308 | Tragic 32.1% |
| Immigrants | Eastern Asia | 0.0 /100 | #309 | Tragic 32.0% |
| Immigrants | Iran | 0.0 /100 | #310 | Tragic 32.0% |
| Indians (Asian) | 0.0 /100 | #311 | Tragic 31.9% |
Demographics Similar to Dutch by In Labor Force | Age 16-19
In terms of in labor force | age 16-19, the demographic groups most similar to Dutch are Chippewa (43.8%, a difference of 0.10%), Finnish (43.9%, a difference of 0.19%), Slovene (43.7%, a difference of 0.36%), Czech (43.6%, a difference of 0.47%), and Scandinavian (43.6%, a difference of 0.53%).
| Demographics | Rating | Rank | In Labor Force | Age 16-19 |
| Somalis | 100.0 /100 | #6 | Exceptional 45.1% |
| Danes | 100.0 /100 | #7 | Exceptional 44.7% |
| Immigrants | Cabo Verde | 100.0 /100 | #8 | Exceptional 44.7% |
| Cape Verdeans | 100.0 /100 | #9 | Exceptional 44.5% |
| Germans | 100.0 /100 | #10 | Exceptional 44.2% |
| Swedes | 100.0 /100 | #11 | Exceptional 44.1% |
| Finns | 100.0 /100 | #12 | Exceptional 43.9% |
| Dutch | 100.0 /100 | #13 | Exceptional 43.8% |
| Chippewa | 100.0 /100 | #14 | Exceptional 43.8% |
| Slovenes | 100.0 /100 | #15 | Exceptional 43.7% |
| Czechs | 100.0 /100 | #16 | Exceptional 43.6% |
| Scandinavians | 100.0 /100 | #17 | Exceptional 43.6% |
| French Canadians | 100.0 /100 | #18 | Exceptional 43.6% |
| Belgians | 100.0 /100 | #19 | Exceptional 43.4% |
| Swiss | 100.0 /100 | #20 | Exceptional 43.3% |