Liberian vs Dominican In Labor Force | Age 20-64
COMPARE
Liberian
Dominican
In Labor Force | Age 20-64
In Labor Force | Age 20-64 Comparison
Liberians
Dominicans
80.9%
IN LABOR FORCE | AGE 20-64
100.0/ 100
METRIC RATING
21st/ 347
METRIC RANK
77.7%
IN LABOR FORCE | AGE 20-64
0.0/ 100
METRIC RATING
297th/ 347
METRIC RANK
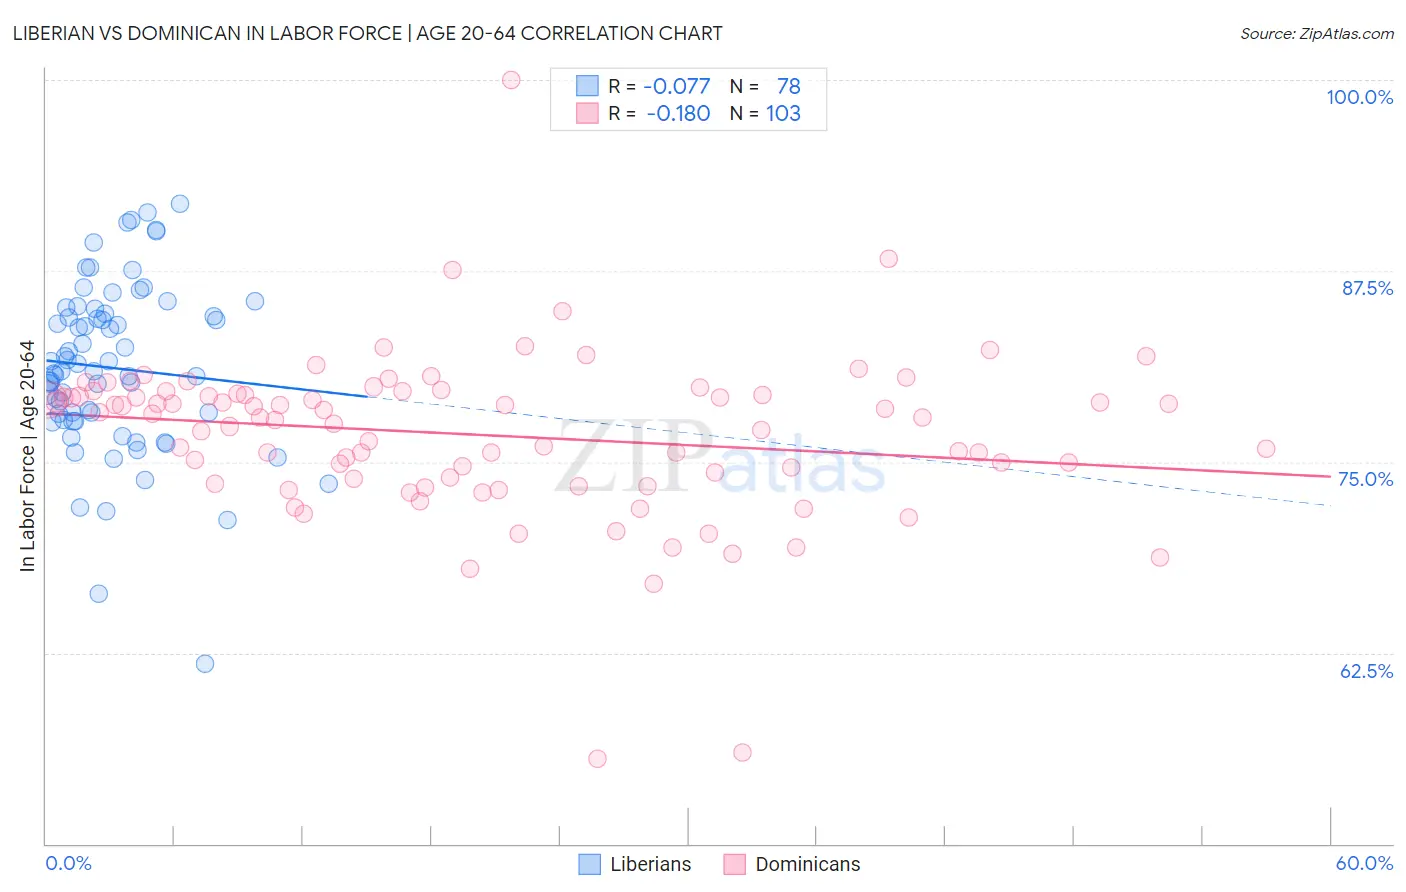
Liberian vs Dominican In Labor Force | Age 20-64 Correlation Chart
The statistical analysis conducted on geographies consisting of 118,097,222 people shows a slight negative correlation between the proportion of Liberians and labor force participation rate among population between the ages 20 and 64 in the United States with a correlation coefficient (R) of -0.077 and weighted average of 80.9%. Similarly, the statistical analysis conducted on geographies consisting of 355,150,221 people shows a poor negative correlation between the proportion of Dominicans and labor force participation rate among population between the ages 20 and 64 in the United States with a correlation coefficient (R) of -0.180 and weighted average of 77.7%, a difference of 4.2%.
In Labor Force | Age 20-64 Correlation Summary
| Measurement | Liberian | Dominican |
| Minimum | 61.8% | 55.6% |
| Maximum | 91.9% | 100.0% |
| Range | 30.1% | 44.4% |
| Mean | 81.1% | 76.8% |
| Median | 80.9% | 77.9% |
| Interquartile 25% (IQ1) | 77.7% | 73.9% |
| Interquartile 75% (IQ3) | 84.7% | 79.5% |
| Interquartile Range (IQR) | 7.0% | 5.6% |
| Standard Deviation (Sample) | 5.6% | 5.5% |
| Standard Deviation (Population) | 5.5% | 5.4% |
Similar Demographics by In Labor Force | Age 20-64
Demographics Similar to Liberians by In Labor Force | Age 20-64
In terms of in labor force | age 20-64, the demographic groups most similar to Liberians are Thai (80.9%, a difference of 0.020%), Immigrants from Bulgaria (81.0%, a difference of 0.070%), Zimbabwean (81.0%, a difference of 0.070%), Sudanese (80.8%, a difference of 0.070%), and Norwegian (81.0%, a difference of 0.080%).
| Demographics | Rating | Rank | In Labor Force | Age 20-64 |
| Cambodians | 100.0 /100 | #14 | Exceptional 81.1% |
| Bulgarians | 100.0 /100 | #15 | Exceptional 81.1% |
| Immigrants | Nepal | 100.0 /100 | #16 | Exceptional 81.1% |
| Norwegians | 100.0 /100 | #17 | Exceptional 81.0% |
| Immigrants | Bulgaria | 100.0 /100 | #18 | Exceptional 81.0% |
| Zimbabweans | 100.0 /100 | #19 | Exceptional 81.0% |
| Thais | 100.0 /100 | #20 | Exceptional 80.9% |
| Liberians | 100.0 /100 | #21 | Exceptional 80.9% |
| Sudanese | 100.0 /100 | #22 | Exceptional 80.8% |
| Immigrants | Bosnia and Herzegovina | 100.0 /100 | #23 | Exceptional 80.8% |
| Immigrants | Morocco | 100.0 /100 | #24 | Exceptional 80.8% |
| Kenyans | 100.0 /100 | #25 | Exceptional 80.8% |
| Immigrants | Serbia | 100.0 /100 | #26 | Exceptional 80.8% |
| Immigrants | Kenya | 99.9 /100 | #27 | Exceptional 80.7% |
| Immigrants | Uganda | 99.9 /100 | #28 | Exceptional 80.7% |
Demographics Similar to Dominicans by In Labor Force | Age 20-64
In terms of in labor force | age 20-64, the demographic groups most similar to Dominicans are Immigrants from Dominican Republic (77.7%, a difference of 0.010%), Cree (77.7%, a difference of 0.010%), Immigrants from Grenada (77.7%, a difference of 0.040%), Immigrants from Central America (77.7%, a difference of 0.070%), and Hispanic or Latino (77.6%, a difference of 0.070%).
| Demographics | Rating | Rank | In Labor Force | Age 20-64 |
| Immigrants | Bangladesh | 0.0 /100 | #290 | Tragic 77.9% |
| Spanish Americans | 0.0 /100 | #291 | Tragic 77.8% |
| Immigrants | Azores | 0.0 /100 | #292 | Tragic 77.8% |
| Delaware | 0.0 /100 | #293 | Tragic 77.8% |
| Immigrants | Central America | 0.0 /100 | #294 | Tragic 77.7% |
| Immigrants | Grenada | 0.0 /100 | #295 | Tragic 77.7% |
| Immigrants | Dominican Republic | 0.0 /100 | #296 | Tragic 77.7% |
| Dominicans | 0.0 /100 | #297 | Tragic 77.7% |
| Cree | 0.0 /100 | #298 | Tragic 77.7% |
| Hispanics or Latinos | 0.0 /100 | #299 | Tragic 77.6% |
| Spanish American Indians | 0.0 /100 | #300 | Tragic 77.6% |
| Nepalese | 0.0 /100 | #301 | Tragic 77.5% |
| Iroquois | 0.0 /100 | #302 | Tragic 77.5% |
| Chippewa | 0.0 /100 | #303 | Tragic 77.3% |
| Immigrants | Mexico | 0.0 /100 | #304 | Tragic 77.3% |