Cherokee vs Dominican In Labor Force | Age 20-64
COMPARE
Cherokee
Dominican
In Labor Force | Age 20-64
In Labor Force | Age 20-64 Comparison
Cherokee
Dominicans
76.2%
IN LABOR FORCE | AGE 20-64
0.0/ 100
METRIC RATING
317th/ 347
METRIC RANK
77.7%
IN LABOR FORCE | AGE 20-64
0.0/ 100
METRIC RATING
297th/ 347
METRIC RANK
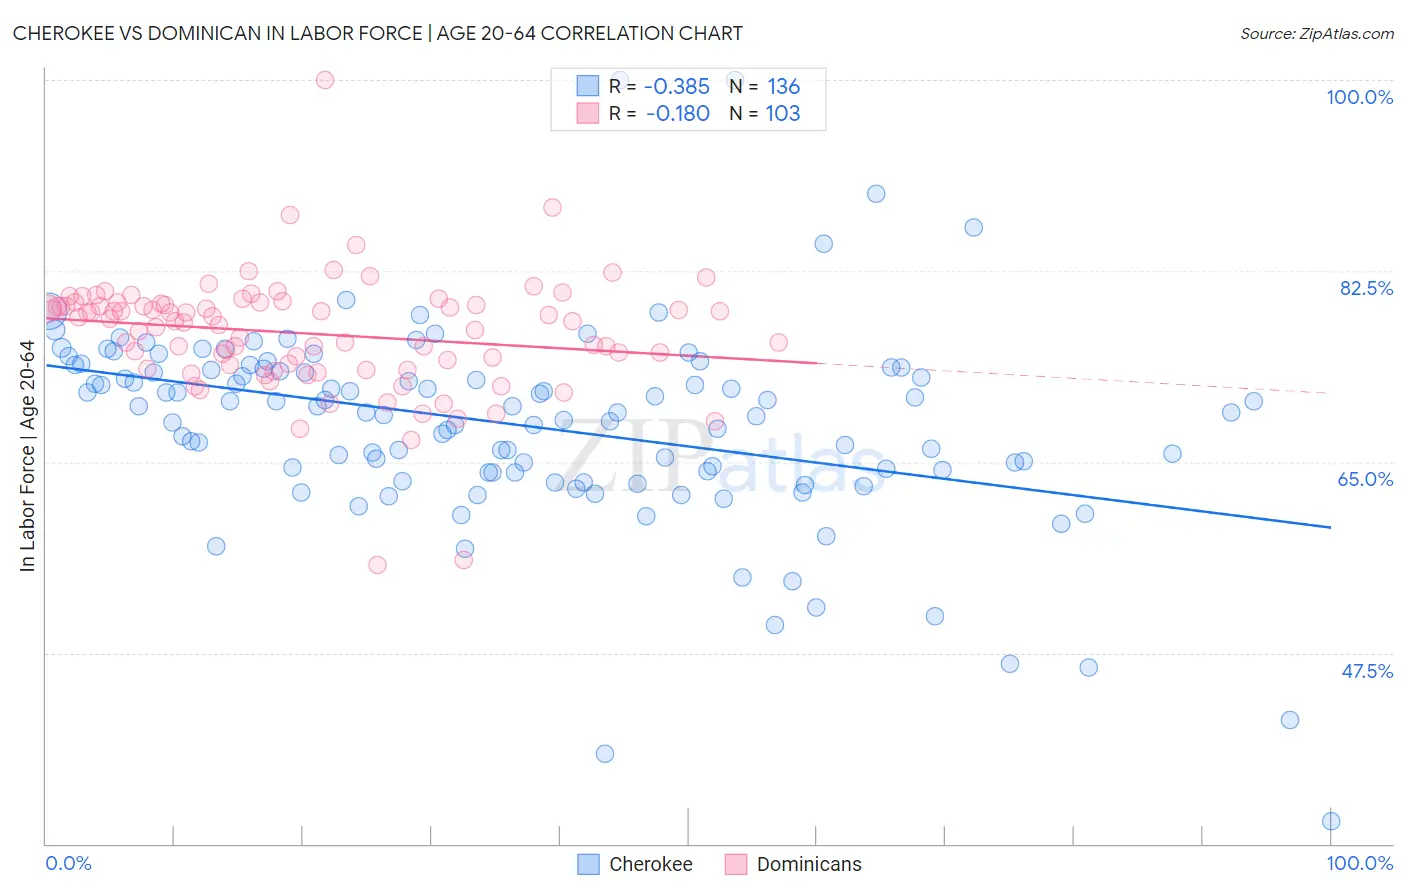
Cherokee vs Dominican In Labor Force | Age 20-64 Correlation Chart
The statistical analysis conducted on geographies consisting of 493,680,494 people shows a mild negative correlation between the proportion of Cherokee and labor force participation rate among population between the ages 20 and 64 in the United States with a correlation coefficient (R) of -0.385 and weighted average of 76.2%. Similarly, the statistical analysis conducted on geographies consisting of 355,150,221 people shows a poor negative correlation between the proportion of Dominicans and labor force participation rate among population between the ages 20 and 64 in the United States with a correlation coefficient (R) of -0.180 and weighted average of 77.7%, a difference of 1.9%.
In Labor Force | Age 20-64 Correlation Summary
| Measurement | Cherokee | Dominican |
| Minimum | 32.1% | 55.6% |
| Maximum | 100.0% | 100.0% |
| Range | 67.9% | 44.4% |
| Mean | 68.4% | 76.8% |
| Median | 69.6% | 77.9% |
| Interquartile 25% (IQ1) | 64.0% | 73.9% |
| Interquartile 75% (IQ3) | 73.5% | 79.5% |
| Interquartile Range (IQR) | 9.5% | 5.6% |
| Standard Deviation (Sample) | 9.3% | 5.5% |
| Standard Deviation (Population) | 9.3% | 5.4% |
Demographics Similar to Cherokee and Dominicans by In Labor Force | Age 20-64
In terms of in labor force | age 20-64, the demographic groups most similar to Cherokee are Yaqui (76.5%, a difference of 0.40%), Ottawa (76.7%, a difference of 0.59%), Black/African American (76.8%, a difference of 0.69%), Shoshone (76.8%, a difference of 0.71%), and Alaskan Athabascan (76.9%, a difference of 0.83%). Similarly, the demographic groups most similar to Dominicans are Cree (77.7%, a difference of 0.010%), Hispanic or Latino (77.6%, a difference of 0.070%), Spanish American Indian (77.6%, a difference of 0.13%), Nepalese (77.5%, a difference of 0.18%), and Iroquois (77.5%, a difference of 0.22%).
| Demographics | Rating | Rank | In Labor Force | Age 20-64 |
| Dominicans | 0.0 /100 | #297 | Tragic 77.7% |
| Cree | 0.0 /100 | #298 | Tragic 77.7% |
| Hispanics or Latinos | 0.0 /100 | #299 | Tragic 77.6% |
| Spanish American Indians | 0.0 /100 | #300 | Tragic 77.6% |
| Nepalese | 0.0 /100 | #301 | Tragic 77.5% |
| Iroquois | 0.0 /100 | #302 | Tragic 77.5% |
| Chippewa | 0.0 /100 | #303 | Tragic 77.3% |
| Immigrants | Mexico | 0.0 /100 | #304 | Tragic 77.3% |
| Mexicans | 0.0 /100 | #305 | Tragic 77.2% |
| Potawatomi | 0.0 /100 | #306 | Tragic 77.2% |
| Central American Indians | 0.0 /100 | #307 | Tragic 77.1% |
| Alaska Natives | 0.0 /100 | #308 | Tragic 77.0% |
| Americans | 0.0 /100 | #309 | Tragic 77.0% |
| Comanche | 0.0 /100 | #310 | Tragic 77.0% |
| Blackfeet | 0.0 /100 | #311 | Tragic 77.0% |
| Alaskan Athabascans | 0.0 /100 | #312 | Tragic 76.9% |
| Shoshone | 0.0 /100 | #313 | Tragic 76.8% |
| Blacks/African Americans | 0.0 /100 | #314 | Tragic 76.8% |
| Ottawa | 0.0 /100 | #315 | Tragic 76.7% |
| Yaqui | 0.0 /100 | #316 | Tragic 76.5% |
| Cherokee | 0.0 /100 | #317 | Tragic 76.2% |