Liberian vs Immigrants from Uruguay In Labor Force | Age 20-64
COMPARE
Liberian
Immigrants from Uruguay
In Labor Force | Age 20-64
In Labor Force | Age 20-64 Comparison
Liberians
Immigrants from Uruguay
80.9%
IN LABOR FORCE | AGE 20-64
100.0/ 100
METRIC RATING
21st/ 347
METRIC RANK
80.1%
IN LABOR FORCE | AGE 20-64
95.8/ 100
METRIC RATING
98th/ 347
METRIC RANK
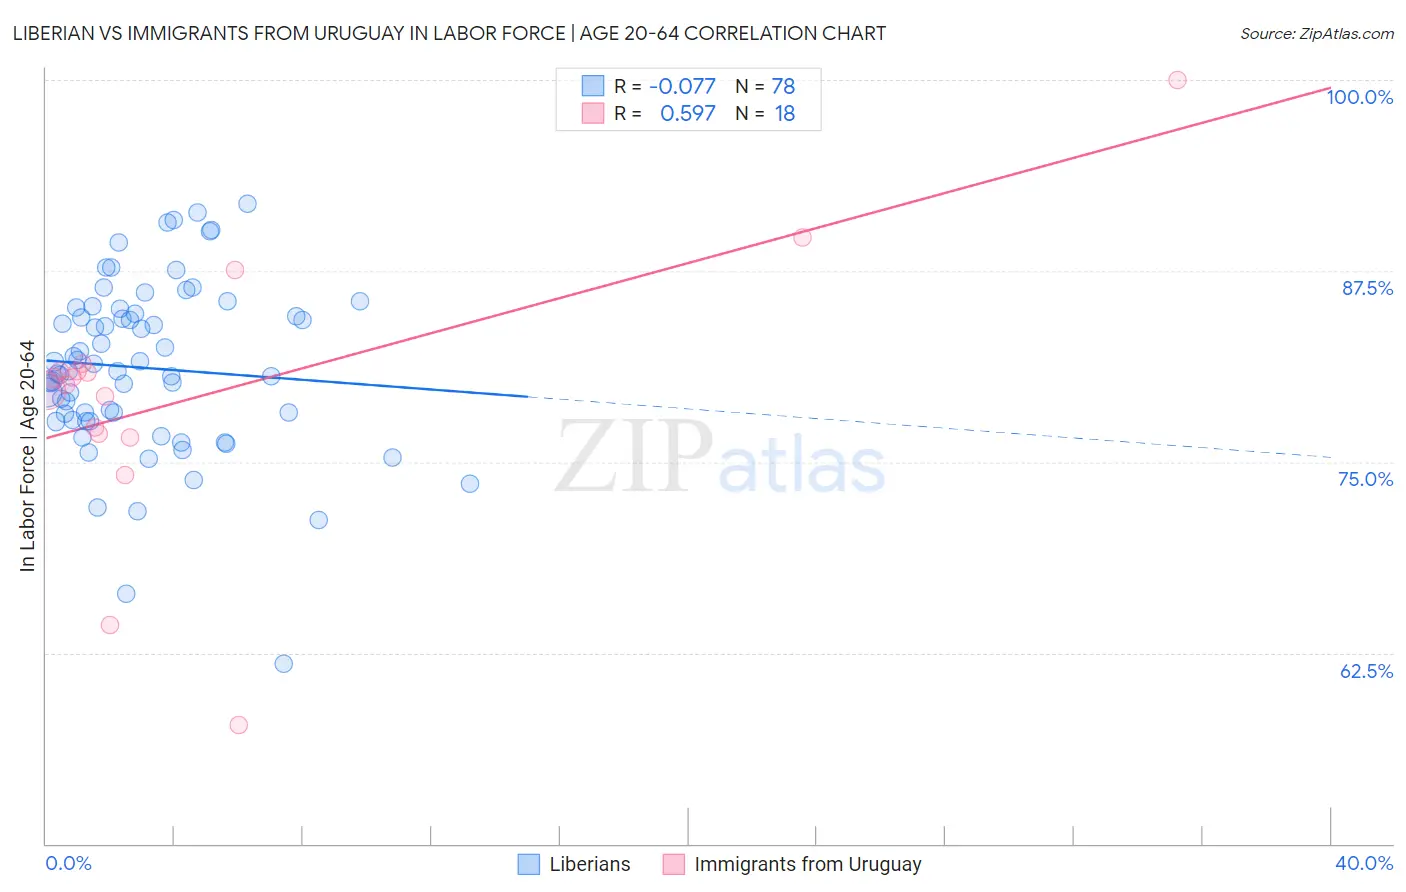
Liberian vs Immigrants from Uruguay In Labor Force | Age 20-64 Correlation Chart
The statistical analysis conducted on geographies consisting of 118,097,222 people shows a slight negative correlation between the proportion of Liberians and labor force participation rate among population between the ages 20 and 64 in the United States with a correlation coefficient (R) of -0.077 and weighted average of 80.9%. Similarly, the statistical analysis conducted on geographies consisting of 133,256,636 people shows a substantial positive correlation between the proportion of Immigrants from Uruguay and labor force participation rate among population between the ages 20 and 64 in the United States with a correlation coefficient (R) of 0.597 and weighted average of 80.1%, a difference of 1.1%.
In Labor Force | Age 20-64 Correlation Summary
| Measurement | Liberian | Immigrants from Uruguay |
| Minimum | 61.8% | 57.8% |
| Maximum | 91.9% | 100.0% |
| Range | 30.1% | 42.2% |
| Mean | 81.1% | 79.4% |
| Median | 80.9% | 80.3% |
| Interquartile 25% (IQ1) | 77.7% | 76.9% |
| Interquartile 75% (IQ3) | 84.7% | 81.0% |
| Interquartile Range (IQR) | 7.0% | 4.1% |
| Standard Deviation (Sample) | 5.6% | 8.9% |
| Standard Deviation (Population) | 5.5% | 8.7% |
Similar Demographics by In Labor Force | Age 20-64
Demographics Similar to Liberians by In Labor Force | Age 20-64
In terms of in labor force | age 20-64, the demographic groups most similar to Liberians are Thai (80.9%, a difference of 0.020%), Immigrants from Bulgaria (81.0%, a difference of 0.070%), Zimbabwean (81.0%, a difference of 0.070%), Sudanese (80.8%, a difference of 0.070%), and Norwegian (81.0%, a difference of 0.080%).
| Demographics | Rating | Rank | In Labor Force | Age 20-64 |
| Cambodians | 100.0 /100 | #14 | Exceptional 81.1% |
| Bulgarians | 100.0 /100 | #15 | Exceptional 81.1% |
| Immigrants | Nepal | 100.0 /100 | #16 | Exceptional 81.1% |
| Norwegians | 100.0 /100 | #17 | Exceptional 81.0% |
| Immigrants | Bulgaria | 100.0 /100 | #18 | Exceptional 81.0% |
| Zimbabweans | 100.0 /100 | #19 | Exceptional 81.0% |
| Thais | 100.0 /100 | #20 | Exceptional 80.9% |
| Liberians | 100.0 /100 | #21 | Exceptional 80.9% |
| Sudanese | 100.0 /100 | #22 | Exceptional 80.8% |
| Immigrants | Bosnia and Herzegovina | 100.0 /100 | #23 | Exceptional 80.8% |
| Immigrants | Morocco | 100.0 /100 | #24 | Exceptional 80.8% |
| Kenyans | 100.0 /100 | #25 | Exceptional 80.8% |
| Immigrants | Serbia | 100.0 /100 | #26 | Exceptional 80.8% |
| Immigrants | Kenya | 99.9 /100 | #27 | Exceptional 80.7% |
| Immigrants | Uganda | 99.9 /100 | #28 | Exceptional 80.7% |
Demographics Similar to Immigrants from Uruguay by In Labor Force | Age 20-64
In terms of in labor force | age 20-64, the demographic groups most similar to Immigrants from Uruguay are Yugoslavian (80.1%, a difference of 0.0%), Immigrants from Malaysia (80.1%, a difference of 0.0%), South American (80.1%, a difference of 0.0%), Immigrants from Asia (80.1%, a difference of 0.010%), and Immigrants from Chile (80.1%, a difference of 0.010%).
| Demographics | Rating | Rank | In Labor Force | Age 20-64 |
| Uruguayans | 96.7 /100 | #91 | Exceptional 80.1% |
| Ghanaians | 96.7 /100 | #92 | Exceptional 80.1% |
| Immigrants | Belarus | 96.4 /100 | #93 | Exceptional 80.1% |
| Immigrants | Asia | 96.0 /100 | #94 | Exceptional 80.1% |
| Yugoslavians | 95.9 /100 | #95 | Exceptional 80.1% |
| Immigrants | Malaysia | 95.9 /100 | #96 | Exceptional 80.1% |
| South Americans | 95.9 /100 | #97 | Exceptional 80.1% |
| Immigrants | Uruguay | 95.8 /100 | #98 | Exceptional 80.1% |
| Immigrants | Chile | 95.7 /100 | #99 | Exceptional 80.1% |
| Filipinos | 95.6 /100 | #100 | Exceptional 80.1% |
| Palestinians | 95.5 /100 | #101 | Exceptional 80.0% |
| Immigrants | Australia | 95.5 /100 | #102 | Exceptional 80.0% |
| Russians | 95.5 /100 | #103 | Exceptional 80.0% |
| Venezuelans | 95.3 /100 | #104 | Exceptional 80.0% |
| Immigrants | Ghana | 95.0 /100 | #105 | Exceptional 80.0% |