Lebanese vs Panamanian In Labor Force | Age 16-19
COMPARE
Lebanese
Panamanian
In Labor Force | Age 16-19
In Labor Force | Age 16-19 Comparison
Lebanese
Panamanians
38.6%
IN LABOR FORCE | AGE 16-19
98.7/ 100
METRIC RATING
109th/ 347
METRIC RANK
36.1%
IN LABOR FORCE | AGE 16-19
28.6/ 100
METRIC RATING
190th/ 347
METRIC RANK
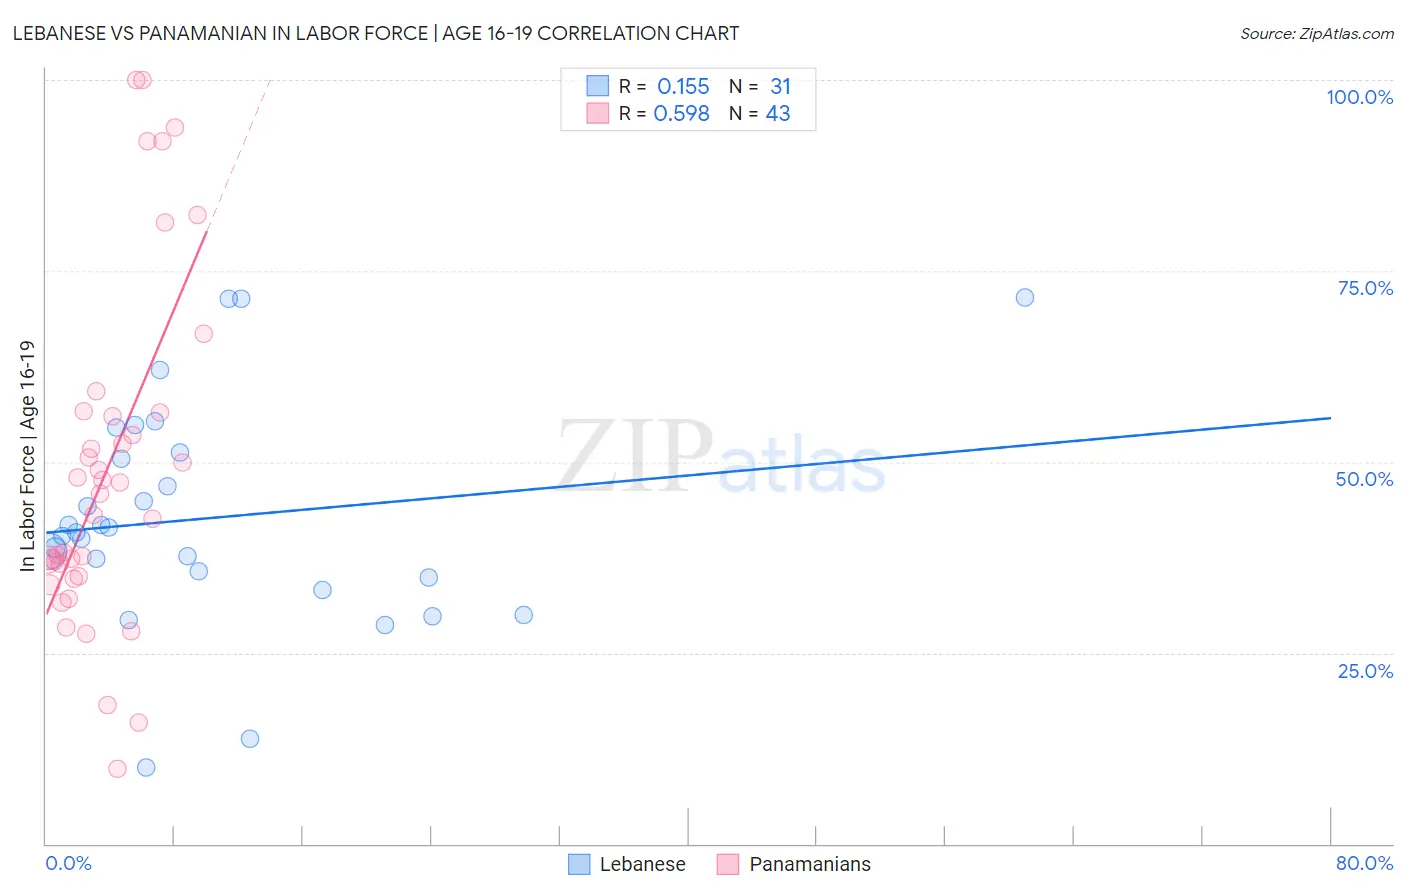
Lebanese vs Panamanian In Labor Force | Age 16-19 Correlation Chart
The statistical analysis conducted on geographies consisting of 401,057,064 people shows a poor positive correlation between the proportion of Lebanese and labor force participation rate among population between the ages 16 and 19 in the United States with a correlation coefficient (R) of 0.155 and weighted average of 38.6%. Similarly, the statistical analysis conducted on geographies consisting of 281,056,655 people shows a substantial positive correlation between the proportion of Panamanians and labor force participation rate among population between the ages 16 and 19 in the United States with a correlation coefficient (R) of 0.598 and weighted average of 36.1%, a difference of 6.7%.
In Labor Force | Age 16-19 Correlation Summary
| Measurement | Lebanese | Panamanian |
| Minimum | 10.0% | 9.9% |
| Maximum | 71.5% | 100.0% |
| Range | 61.5% | 90.1% |
| Mean | 42.6% | 49.1% |
| Median | 40.7% | 45.8% |
| Interquartile 25% (IQ1) | 34.9% | 35.1% |
| Interquartile 75% (IQ3) | 51.3% | 56.4% |
| Interquartile Range (IQR) | 16.4% | 21.3% |
| Standard Deviation (Sample) | 14.6% | 22.4% |
| Standard Deviation (Population) | 14.3% | 22.1% |
Similar Demographics by In Labor Force | Age 16-19
Demographics Similar to Lebanese by In Labor Force | Age 16-19
In terms of in labor force | age 16-19, the demographic groups most similar to Lebanese are Immigrants from Ethiopia (38.6%, a difference of 0.0%), Chinese (38.6%, a difference of 0.10%), Maltese (38.5%, a difference of 0.12%), Delaware (38.6%, a difference of 0.13%), and Iraqi (38.6%, a difference of 0.15%).
| Demographics | Rating | Rank | In Labor Force | Age 16-19 |
| Zimbabweans | 99.1 /100 | #102 | Exceptional 38.7% |
| Immigrants | Cameroon | 99.0 /100 | #103 | Exceptional 38.7% |
| Immigrants | Eritrea | 99.0 /100 | #104 | Exceptional 38.7% |
| Iraqis | 98.9 /100 | #105 | Exceptional 38.6% |
| Delaware | 98.8 /100 | #106 | Exceptional 38.6% |
| Chinese | 98.8 /100 | #107 | Exceptional 38.6% |
| Immigrants | Ethiopia | 98.7 /100 | #108 | Exceptional 38.6% |
| Lebanese | 98.7 /100 | #109 | Exceptional 38.6% |
| Maltese | 98.6 /100 | #110 | Exceptional 38.5% |
| Crow | 98.5 /100 | #111 | Exceptional 38.5% |
| Immigrants | Scotland | 98.5 /100 | #112 | Exceptional 38.5% |
| Sub-Saharan Africans | 98.3 /100 | #113 | Exceptional 38.4% |
| Hawaiians | 98.2 /100 | #114 | Exceptional 38.4% |
| Bulgarians | 97.9 /100 | #115 | Exceptional 38.3% |
| Colville | 97.9 /100 | #116 | Exceptional 38.3% |
Demographics Similar to Panamanians by In Labor Force | Age 16-19
In terms of in labor force | age 16-19, the demographic groups most similar to Panamanians are Immigrants from Hungary (36.2%, a difference of 0.010%), Immigrants from Croatia (36.1%, a difference of 0.070%), Immigrants from Europe (36.2%, a difference of 0.19%), Afghan (36.1%, a difference of 0.19%), and Immigrants from Denmark (36.1%, a difference of 0.23%).
| Demographics | Rating | Rank | In Labor Force | Age 16-19 |
| Eastern Europeans | 38.8 /100 | #183 | Fair 36.4% |
| Costa Ricans | 36.1 /100 | #184 | Fair 36.3% |
| Bhutanese | 35.3 /100 | #185 | Fair 36.3% |
| Immigrants | Romania | 34.0 /100 | #186 | Fair 36.3% |
| Immigrants | Afghanistan | 34.0 /100 | #187 | Fair 36.3% |
| Immigrants | Europe | 31.8 /100 | #188 | Fair 36.2% |
| Immigrants | Hungary | 28.8 /100 | #189 | Fair 36.2% |
| Panamanians | 28.6 /100 | #190 | Fair 36.1% |
| Immigrants | Croatia | 27.5 /100 | #191 | Fair 36.1% |
| Afghans | 25.7 /100 | #192 | Fair 36.1% |
| Immigrants | Denmark | 25.0 /100 | #193 | Fair 36.1% |
| Nigerians | 24.6 /100 | #194 | Fair 36.1% |
| Bolivians | 23.3 /100 | #195 | Fair 36.0% |
| Mexican American Indians | 21.1 /100 | #196 | Fair 36.0% |
| Immigrants | Serbia | 21.0 /100 | #197 | Fair 36.0% |