Latvian vs Cypriot Per Capita Income
COMPARE
Latvian
Cypriot
Per Capita Income
Per Capita Income Comparison
Latvians
Cypriots
$52,649
PER CAPITA INCOME
100.0/ 100
METRIC RATING
28th/ 347
METRIC RANK
$54,899
PER CAPITA INCOME
100.0/ 100
METRIC RATING
15th/ 347
METRIC RANK
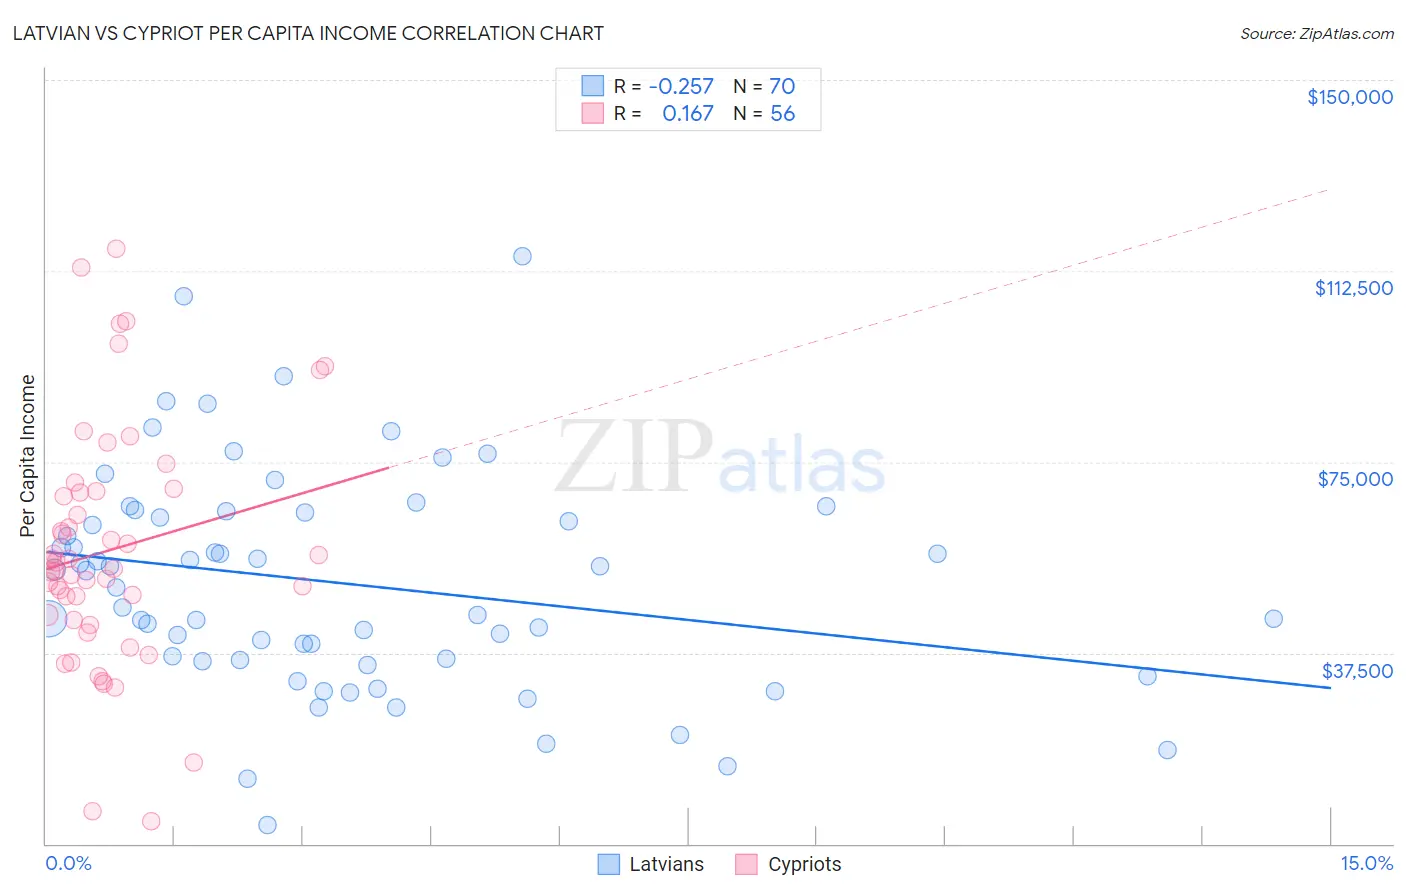
Latvian vs Cypriot Per Capita Income Correlation Chart
The statistical analysis conducted on geographies consisting of 220,728,386 people shows a weak negative correlation between the proportion of Latvians and per capita income in the United States with a correlation coefficient (R) of -0.257 and weighted average of $52,649. Similarly, the statistical analysis conducted on geographies consisting of 61,866,365 people shows a poor positive correlation between the proportion of Cypriots and per capita income in the United States with a correlation coefficient (R) of 0.167 and weighted average of $54,899, a difference of 4.3%.
Per Capita Income Correlation Summary
| Measurement | Latvian | Cypriot |
| Minimum | $3,646 | $4,509 |
| Maximum | $115,504 | $116,766 |
| Range | $111,858 | $112,257 |
| Mean | $51,165 | $57,593 |
| Median | $52,046 | $54,638 |
| Interquartile 25% (IQ1) | $36,086 | $44,518 |
| Interquartile 75% (IQ3) | $65,124 | $69,117 |
| Interquartile Range (IQR) | $29,038 | $24,599 |
| Standard Deviation (Sample) | $21,773 | $23,513 |
| Standard Deviation (Population) | $21,617 | $23,302 |
Demographics Similar to Latvians and Cypriots by Per Capita Income
In terms of per capita income, the demographic groups most similar to Latvians are Immigrants from South Central Asia ($52,660, a difference of 0.020%), Israeli ($52,596, a difference of 0.10%), Immigrants from Austria ($52,503, a difference of 0.28%), Turkish ($52,391, a difference of 0.49%), and Russian ($53,154, a difference of 0.96%). Similarly, the demographic groups most similar to Cypriots are Immigrants from Switzerland ($54,866, a difference of 0.060%), Immigrants from Belgium ($55,082, a difference of 0.33%), Immigrants from France ($54,557, a difference of 0.63%), Immigrants from India ($55,268, a difference of 0.67%), and Thai ($54,307, a difference of 1.1%).
| Demographics | Rating | Rank | Per Capita Income |
| Eastern Europeans | 100.0 /100 | #11 | Exceptional $55,780 |
| Immigrants | Sweden | 100.0 /100 | #12 | Exceptional $55,582 |
| Immigrants | India | 100.0 /100 | #13 | Exceptional $55,268 |
| Immigrants | Belgium | 100.0 /100 | #14 | Exceptional $55,082 |
| Cypriots | 100.0 /100 | #15 | Exceptional $54,899 |
| Immigrants | Switzerland | 100.0 /100 | #16 | Exceptional $54,866 |
| Immigrants | France | 100.0 /100 | #17 | Exceptional $54,557 |
| Thais | 100.0 /100 | #18 | Exceptional $54,307 |
| Immigrants | China | 100.0 /100 | #19 | Exceptional $54,264 |
| Soviet Union | 100.0 /100 | #20 | Exceptional $54,202 |
| Immigrants | Northern Europe | 100.0 /100 | #21 | Exceptional $54,159 |
| Indians (Asian) | 100.0 /100 | #22 | Exceptional $53,874 |
| Immigrants | Eastern Asia | 100.0 /100 | #23 | Exceptional $53,806 |
| Immigrants | Denmark | 100.0 /100 | #24 | Exceptional $53,799 |
| Immigrants | Japan | 100.0 /100 | #25 | Exceptional $53,359 |
| Russians | 100.0 /100 | #26 | Exceptional $53,154 |
| Immigrants | South Central Asia | 100.0 /100 | #27 | Exceptional $52,660 |
| Latvians | 100.0 /100 | #28 | Exceptional $52,649 |
| Israelis | 100.0 /100 | #29 | Exceptional $52,596 |
| Immigrants | Austria | 100.0 /100 | #30 | Exceptional $52,503 |
| Turks | 100.0 /100 | #31 | Exceptional $52,391 |