Laotian vs Nepalese In Labor Force | Age 30-34
COMPARE
Laotian
Nepalese
In Labor Force | Age 30-34
In Labor Force | Age 30-34 Comparison
Laotians
Nepalese
84.7%
IN LABOR FORCE | AGE 30-34
46.9/ 100
METRIC RATING
177th/ 347
METRIC RANK
82.7%
IN LABOR FORCE | AGE 30-34
0.0/ 100
METRIC RATING
293rd/ 347
METRIC RANK
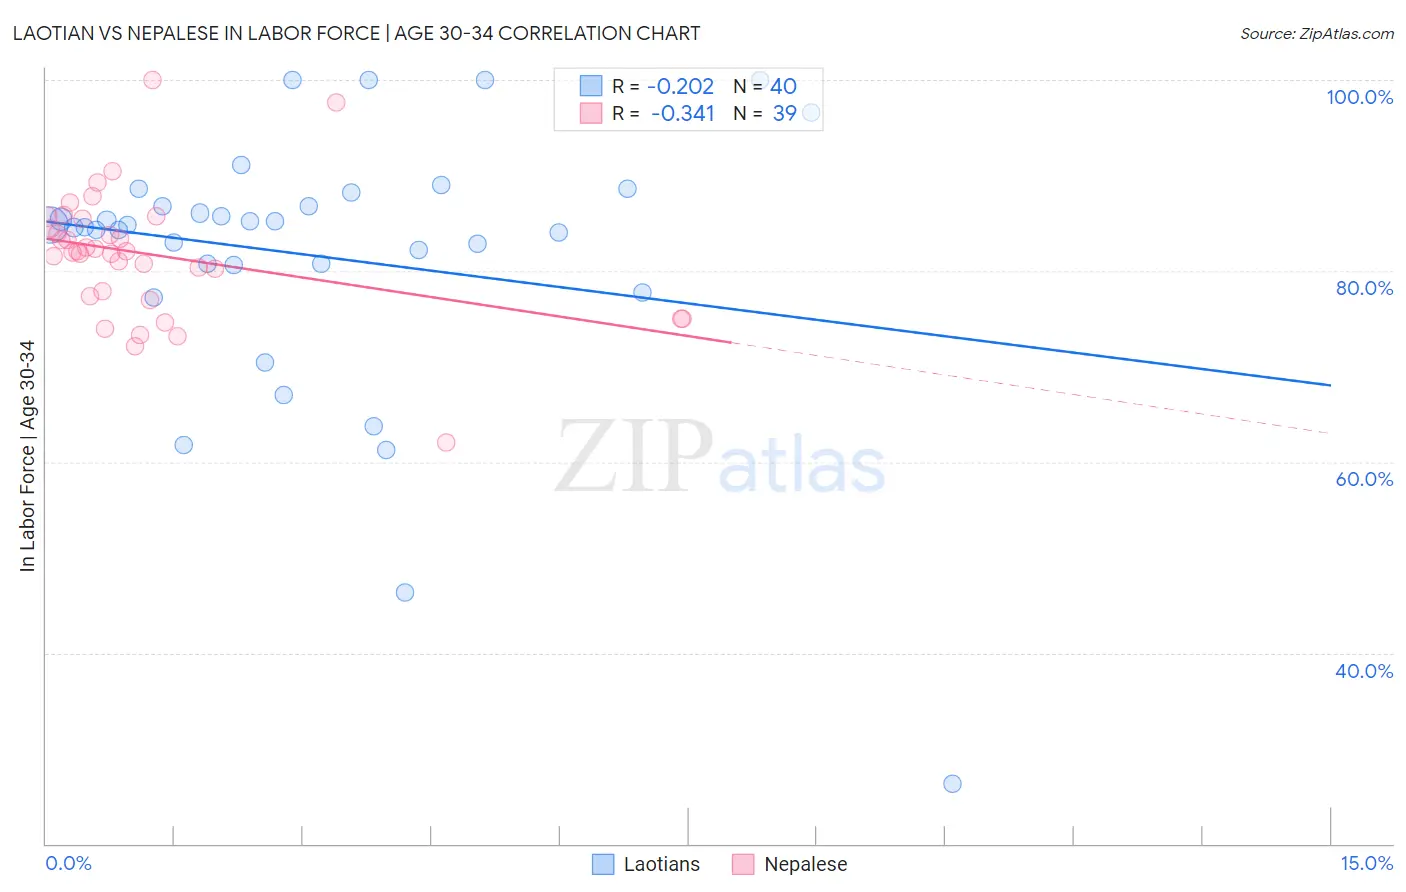
Laotian vs Nepalese In Labor Force | Age 30-34 Correlation Chart
The statistical analysis conducted on geographies consisting of 224,759,127 people shows a weak negative correlation between the proportion of Laotians and labor force participation rate among population between the ages 30 and 34 in the United States with a correlation coefficient (R) of -0.202 and weighted average of 84.7%. Similarly, the statistical analysis conducted on geographies consisting of 24,520,458 people shows a mild negative correlation between the proportion of Nepalese and labor force participation rate among population between the ages 30 and 34 in the United States with a correlation coefficient (R) of -0.341 and weighted average of 82.7%, a difference of 2.4%.
In Labor Force | Age 30-34 Correlation Summary
| Measurement | Laotian | Nepalese |
| Minimum | 26.3% | 62.0% |
| Maximum | 100.0% | 100.0% |
| Range | 73.7% | 38.0% |
| Mean | 81.6% | 81.7% |
| Median | 84.7% | 82.1% |
| Interquartile 25% (IQ1) | 80.7% | 77.3% |
| Interquartile 75% (IQ3) | 87.5% | 85.4% |
| Interquartile Range (IQR) | 6.8% | 8.1% |
| Standard Deviation (Sample) | 14.2% | 6.8% |
| Standard Deviation (Population) | 14.0% | 6.7% |
Similar Demographics by In Labor Force | Age 30-34
Demographics Similar to Laotians by In Labor Force | Age 30-34
In terms of in labor force | age 30-34, the demographic groups most similar to Laotians are Finnish (84.7%, a difference of 0.020%), Immigrants from South America (84.7%, a difference of 0.020%), Immigrants from Uzbekistan (84.7%, a difference of 0.020%), Okinawan (84.6%, a difference of 0.020%), and Immigrants from England (84.7%, a difference of 0.030%).
| Demographics | Rating | Rank | In Labor Force | Age 30-34 |
| Immigrants | Burma/Myanmar | 52.0 /100 | #170 | Average 84.7% |
| Irish | 52.0 /100 | #171 | Average 84.7% |
| Immigrants | England | 51.7 /100 | #172 | Average 84.7% |
| Israelis | 51.1 /100 | #173 | Average 84.7% |
| Finns | 50.0 /100 | #174 | Average 84.7% |
| Immigrants | South America | 50.0 /100 | #175 | Average 84.7% |
| Immigrants | Uzbekistan | 49.1 /100 | #176 | Average 84.7% |
| Laotians | 46.9 /100 | #177 | Average 84.7% |
| Okinawans | 44.1 /100 | #178 | Average 84.6% |
| Immigrants | Nigeria | 42.5 /100 | #179 | Average 84.6% |
| Immigrants | Netherlands | 42.1 /100 | #180 | Average 84.6% |
| Moroccans | 40.3 /100 | #181 | Average 84.6% |
| Barbadians | 36.7 /100 | #182 | Fair 84.6% |
| Immigrants | Canada | 35.0 /100 | #183 | Fair 84.6% |
| Immigrants | North America | 33.3 /100 | #184 | Fair 84.6% |
Demographics Similar to Nepalese by In Labor Force | Age 30-34
In terms of in labor force | age 30-34, the demographic groups most similar to Nepalese are American (82.7%, a difference of 0.020%), Black/African American (82.8%, a difference of 0.060%), Potawatomi (82.8%, a difference of 0.080%), Blackfeet (82.8%, a difference of 0.11%), and Pennsylvania German (82.6%, a difference of 0.14%).
| Demographics | Rating | Rank | In Labor Force | Age 30-34 |
| Immigrants | Latin America | 0.0 /100 | #286 | Tragic 83.1% |
| Native Hawaiians | 0.0 /100 | #287 | Tragic 83.0% |
| Central American Indians | 0.0 /100 | #288 | Tragic 83.0% |
| Hawaiians | 0.0 /100 | #289 | Tragic 83.0% |
| Blackfeet | 0.0 /100 | #290 | Tragic 82.8% |
| Potawatomi | 0.0 /100 | #291 | Tragic 82.8% |
| Blacks/African Americans | 0.0 /100 | #292 | Tragic 82.8% |
| Nepalese | 0.0 /100 | #293 | Tragic 82.7% |
| Americans | 0.0 /100 | #294 | Tragic 82.7% |
| Pennsylvania Germans | 0.0 /100 | #295 | Tragic 82.6% |
| Chippewa | 0.0 /100 | #296 | Tragic 82.6% |
| Comanche | 0.0 /100 | #297 | Tragic 82.6% |
| Aleuts | 0.0 /100 | #298 | Tragic 82.6% |
| Immigrants | Central America | 0.0 /100 | #299 | Tragic 82.5% |
| Hmong | 0.0 /100 | #300 | Tragic 82.4% |