Kiowa vs Immigrants from Scotland In Labor Force | Age 45-54
COMPARE
Kiowa
Immigrants from Scotland
In Labor Force | Age 45-54
In Labor Force | Age 45-54 Comparison
Kiowa
Immigrants from Scotland
78.3%
IN LABOR FORCE | AGE 45-54
0.0/ 100
METRIC RATING
323rd/ 347
METRIC RANK
83.0%
IN LABOR FORCE | AGE 45-54
77.8/ 100
METRIC RATING
142nd/ 347
METRIC RANK
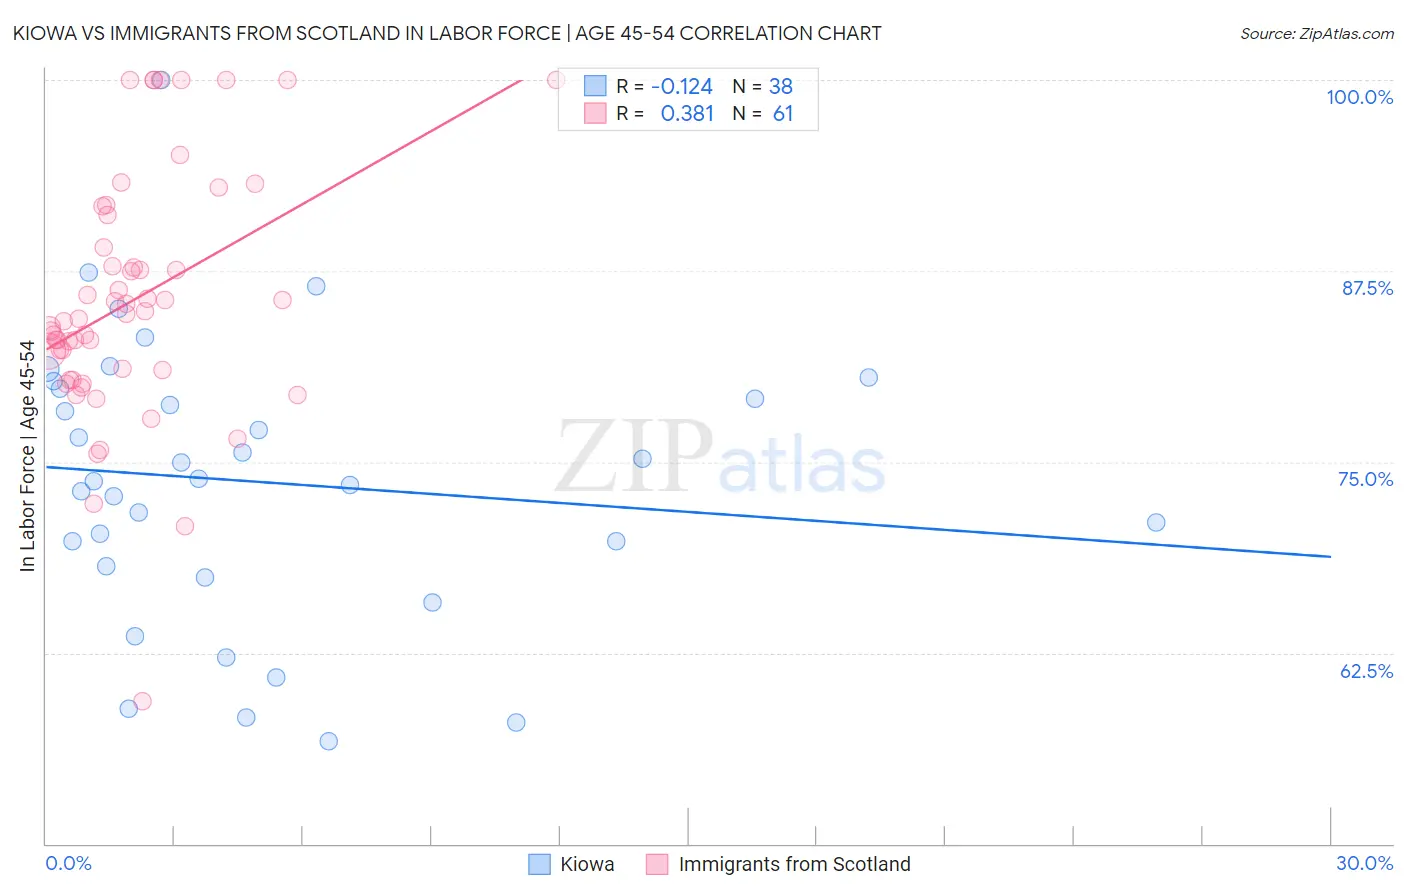
Kiowa vs Immigrants from Scotland In Labor Force | Age 45-54 Correlation Chart
The statistical analysis conducted on geographies consisting of 56,098,300 people shows a poor negative correlation between the proportion of Kiowa and labor force participation rate among population between the ages 45 and 54 in the United States with a correlation coefficient (R) of -0.124 and weighted average of 78.3%. Similarly, the statistical analysis conducted on geographies consisting of 196,370,996 people shows a mild positive correlation between the proportion of Immigrants from Scotland and labor force participation rate among population between the ages 45 and 54 in the United States with a correlation coefficient (R) of 0.381 and weighted average of 83.0%, a difference of 6.0%.
In Labor Force | Age 45-54 Correlation Summary
| Measurement | Kiowa | Immigrants from Scotland |
| Minimum | 56.7% | 59.3% |
| Maximum | 100.0% | 100.0% |
| Range | 43.3% | 40.7% |
| Mean | 73.7% | 85.6% |
| Median | 73.8% | 84.4% |
| Interquartile 25% (IQ1) | 68.2% | 80.7% |
| Interquartile 75% (IQ3) | 79.8% | 90.1% |
| Interquartile Range (IQR) | 11.6% | 9.4% |
| Standard Deviation (Sample) | 9.3% | 8.1% |
| Standard Deviation (Population) | 9.2% | 8.0% |
Similar Demographics by In Labor Force | Age 45-54
Demographics Similar to Kiowa by In Labor Force | Age 45-54
In terms of in labor force | age 45-54, the demographic groups most similar to Kiowa are Dutch West Indian (78.2%, a difference of 0.020%), Crow (78.3%, a difference of 0.080%), Choctaw (78.2%, a difference of 0.11%), Seminole (78.1%, a difference of 0.16%), and Cajun (78.1%, a difference of 0.16%).
| Demographics | Rating | Rank | In Labor Force | Age 45-54 |
| Shoshone | 0.0 /100 | #316 | Tragic 79.3% |
| Comanche | 0.0 /100 | #317 | Tragic 79.2% |
| Chickasaw | 0.0 /100 | #318 | Tragic 79.0% |
| Cherokee | 0.0 /100 | #319 | Tragic 79.0% |
| Yaqui | 0.0 /100 | #320 | Tragic 78.9% |
| Yup'ik | 0.0 /100 | #321 | Tragic 78.6% |
| Crow | 0.0 /100 | #322 | Tragic 78.3% |
| Kiowa | 0.0 /100 | #323 | Tragic 78.3% |
| Dutch West Indians | 0.0 /100 | #324 | Tragic 78.2% |
| Choctaw | 0.0 /100 | #325 | Tragic 78.2% |
| Seminole | 0.0 /100 | #326 | Tragic 78.1% |
| Cajuns | 0.0 /100 | #327 | Tragic 78.1% |
| Sioux | 0.0 /100 | #328 | Tragic 78.0% |
| Creek | 0.0 /100 | #329 | Tragic 77.7% |
| Cheyenne | 0.0 /100 | #330 | Tragic 77.6% |
Demographics Similar to Immigrants from Scotland by In Labor Force | Age 45-54
In terms of in labor force | age 45-54, the demographic groups most similar to Immigrants from Scotland are Immigrants from Haiti (83.0%, a difference of 0.0%), Scandinavian (83.0%, a difference of 0.010%), Yugoslavian (83.0%, a difference of 0.010%), Okinawan (83.0%, a difference of 0.010%), and Soviet Union (83.0%, a difference of 0.010%).
| Demographics | Rating | Rank | In Labor Force | Age 45-54 |
| Austrians | 81.3 /100 | #135 | Excellent 83.0% |
| Immigrants | Kazakhstan | 81.0 /100 | #136 | Excellent 83.0% |
| Immigrants | Spain | 80.4 /100 | #137 | Excellent 83.0% |
| Ghanaians | 79.5 /100 | #138 | Good 83.0% |
| Scandinavians | 78.5 /100 | #139 | Good 83.0% |
| Yugoslavians | 78.3 /100 | #140 | Good 83.0% |
| Immigrants | Haiti | 77.9 /100 | #141 | Good 83.0% |
| Immigrants | Scotland | 77.8 /100 | #142 | Good 83.0% |
| Okinawans | 77.0 /100 | #143 | Good 83.0% |
| Soviet Union | 76.8 /100 | #144 | Good 83.0% |
| Romanians | 75.4 /100 | #145 | Good 83.0% |
| Immigrants | France | 75.3 /100 | #146 | Good 83.0% |
| Czechoslovakians | 74.8 /100 | #147 | Good 83.0% |
| Immigrants | Nigeria | 74.1 /100 | #148 | Good 83.0% |
| Immigrants | Sweden | 73.3 /100 | #149 | Good 82.9% |