Kiowa vs Dominican In Labor Force | Age 45-54
COMPARE
Kiowa
Dominican
In Labor Force | Age 45-54
In Labor Force | Age 45-54 Comparison
Kiowa
Dominicans
78.3%
IN LABOR FORCE | AGE 45-54
0.0/ 100
METRIC RATING
323rd/ 347
METRIC RANK
80.3%
IN LABOR FORCE | AGE 45-54
0.0/ 100
METRIC RATING
299th/ 347
METRIC RANK
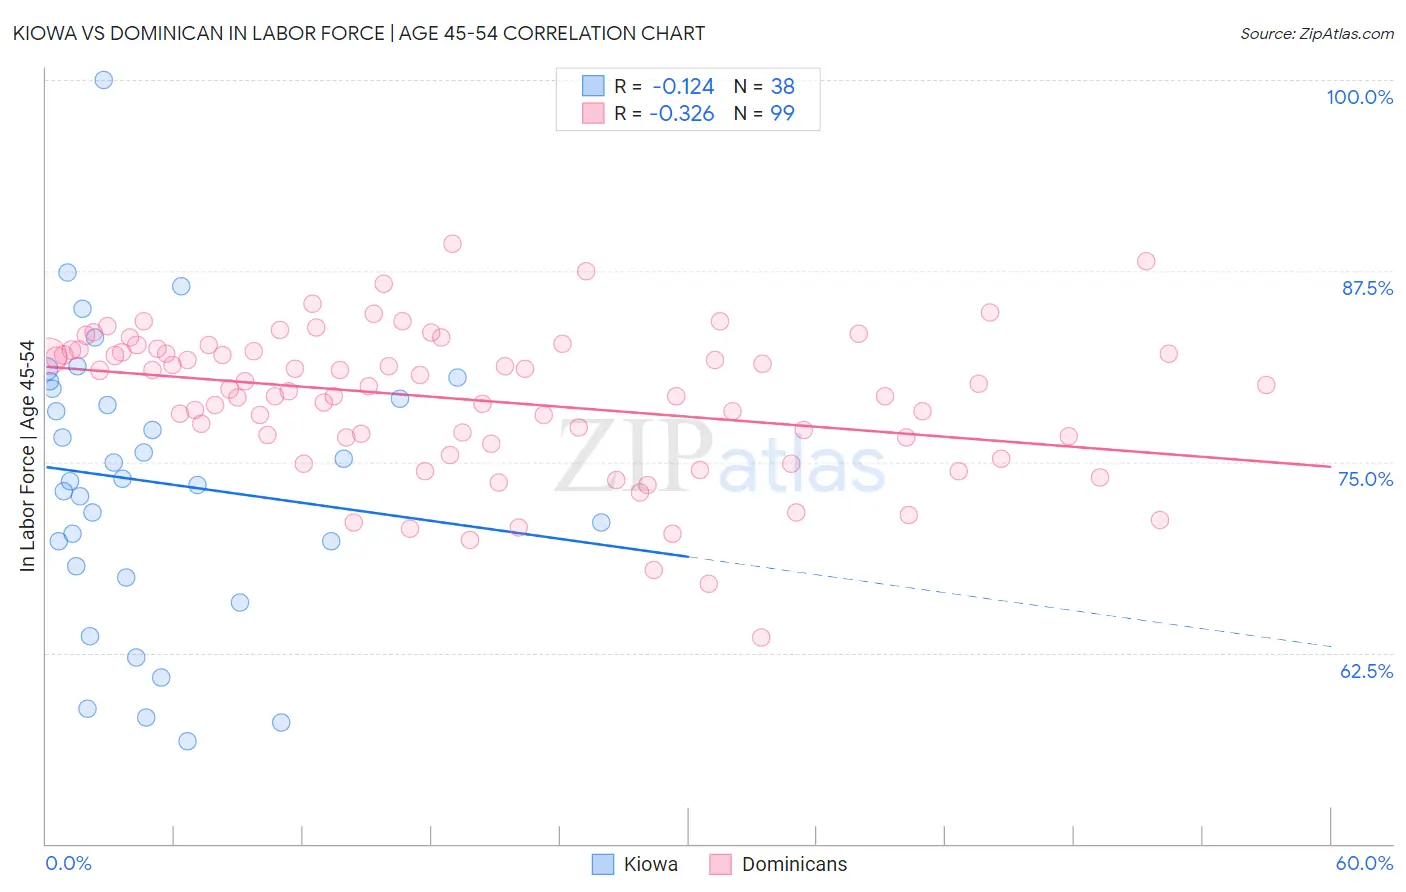
Kiowa vs Dominican In Labor Force | Age 45-54 Correlation Chart
The statistical analysis conducted on geographies consisting of 56,098,300 people shows a poor negative correlation between the proportion of Kiowa and labor force participation rate among population between the ages 45 and 54 in the United States with a correlation coefficient (R) of -0.124 and weighted average of 78.3%. Similarly, the statistical analysis conducted on geographies consisting of 354,749,305 people shows a mild negative correlation between the proportion of Dominicans and labor force participation rate among population between the ages 45 and 54 in the United States with a correlation coefficient (R) of -0.326 and weighted average of 80.3%, a difference of 2.5%.
In Labor Force | Age 45-54 Correlation Summary
| Measurement | Kiowa | Dominican |
| Minimum | 56.7% | 63.5% |
| Maximum | 100.0% | 89.3% |
| Range | 43.3% | 25.8% |
| Mean | 73.7% | 79.0% |
| Median | 73.8% | 80.0% |
| Interquartile 25% (IQ1) | 68.2% | 76.6% |
| Interquartile 75% (IQ3) | 79.8% | 82.3% |
| Interquartile Range (IQR) | 11.6% | 5.8% |
| Standard Deviation (Sample) | 9.3% | 4.8% |
| Standard Deviation (Population) | 9.2% | 4.8% |
Similar Demographics by In Labor Force | Age 45-54
Demographics Similar to Kiowa by In Labor Force | Age 45-54
In terms of in labor force | age 45-54, the demographic groups most similar to Kiowa are Dutch West Indian (78.2%, a difference of 0.020%), Crow (78.3%, a difference of 0.080%), Choctaw (78.2%, a difference of 0.11%), Seminole (78.1%, a difference of 0.16%), and Cajun (78.1%, a difference of 0.16%).
| Demographics | Rating | Rank | In Labor Force | Age 45-54 |
| Shoshone | 0.0 /100 | #316 | Tragic 79.3% |
| Comanche | 0.0 /100 | #317 | Tragic 79.2% |
| Chickasaw | 0.0 /100 | #318 | Tragic 79.0% |
| Cherokee | 0.0 /100 | #319 | Tragic 79.0% |
| Yaqui | 0.0 /100 | #320 | Tragic 78.9% |
| Yup'ik | 0.0 /100 | #321 | Tragic 78.6% |
| Crow | 0.0 /100 | #322 | Tragic 78.3% |
| Kiowa | 0.0 /100 | #323 | Tragic 78.3% |
| Dutch West Indians | 0.0 /100 | #324 | Tragic 78.2% |
| Choctaw | 0.0 /100 | #325 | Tragic 78.2% |
| Seminole | 0.0 /100 | #326 | Tragic 78.1% |
| Cajuns | 0.0 /100 | #327 | Tragic 78.1% |
| Sioux | 0.0 /100 | #328 | Tragic 78.0% |
| Creek | 0.0 /100 | #329 | Tragic 77.7% |
| Cheyenne | 0.0 /100 | #330 | Tragic 77.6% |
Demographics Similar to Dominicans by In Labor Force | Age 45-54
In terms of in labor force | age 45-54, the demographic groups most similar to Dominicans are Fijian (80.2%, a difference of 0.0%), Spanish American Indian (80.2%, a difference of 0.020%), Immigrants from Central America (80.2%, a difference of 0.10%), Marshallese (80.3%, a difference of 0.11%), and American (80.4%, a difference of 0.15%).
| Demographics | Rating | Rank | In Labor Force | Age 45-54 |
| Iroquois | 0.0 /100 | #292 | Tragic 80.6% |
| Osage | 0.0 /100 | #293 | Tragic 80.6% |
| Yakama | 0.0 /100 | #294 | Tragic 80.6% |
| Nepalese | 0.0 /100 | #295 | Tragic 80.5% |
| Africans | 0.0 /100 | #296 | Tragic 80.5% |
| Americans | 0.0 /100 | #297 | Tragic 80.4% |
| Marshallese | 0.0 /100 | #298 | Tragic 80.3% |
| Dominicans | 0.0 /100 | #299 | Tragic 80.3% |
| Fijians | 0.0 /100 | #300 | Tragic 80.2% |
| Spanish American Indians | 0.0 /100 | #301 | Tragic 80.2% |
| Immigrants | Central America | 0.0 /100 | #302 | Tragic 80.2% |
| Immigrants | Azores | 0.0 /100 | #303 | Tragic 80.1% |
| Hispanics or Latinos | 0.0 /100 | #304 | Tragic 80.1% |
| Immigrants | Dominican Republic | 0.0 /100 | #305 | Tragic 80.1% |
| Spanish Americans | 0.0 /100 | #306 | Tragic 80.1% |