Central American vs Immigrants from Trinidad and Tobago In Labor Force | Age 20-64
COMPARE
Central American
Immigrants from Trinidad and Tobago
In Labor Force | Age 20-64
In Labor Force | Age 20-64 Comparison
Central Americans
Immigrants from Trinidad and Tobago
79.1%
IN LABOR FORCE | AGE 20-64
5.9/ 100
METRIC RATING
226th/ 347
METRIC RANK
78.8%
IN LABOR FORCE | AGE 20-64
1.1/ 100
METRIC RATING
246th/ 347
METRIC RANK
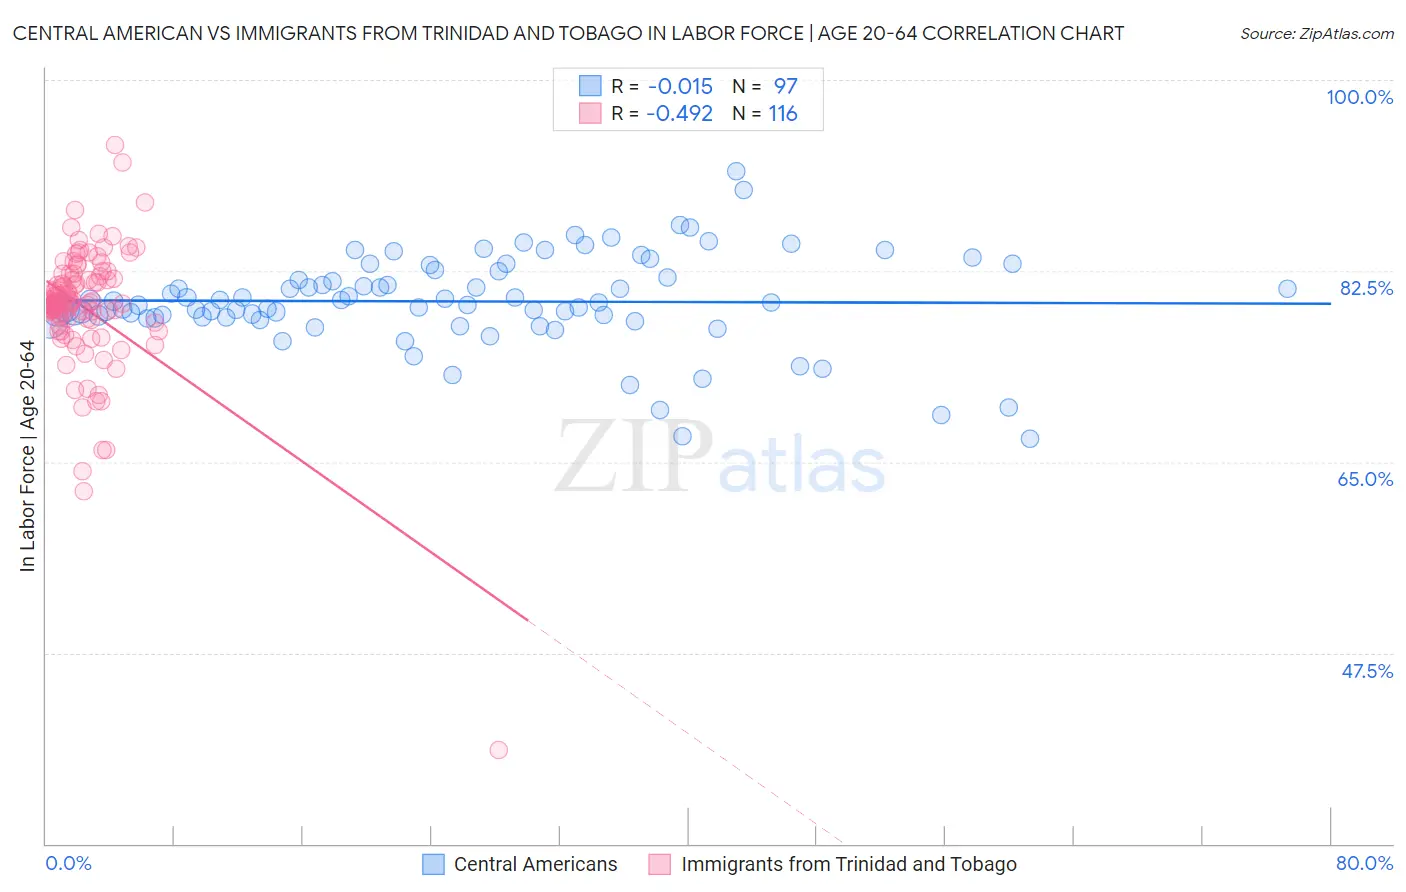
Central American vs Immigrants from Trinidad and Tobago In Labor Force | Age 20-64 Correlation Chart
The statistical analysis conducted on geographies consisting of 504,611,399 people shows no correlation between the proportion of Central Americans and labor force participation rate among population between the ages 20 and 64 in the United States with a correlation coefficient (R) of -0.015 and weighted average of 79.1%. Similarly, the statistical analysis conducted on geographies consisting of 223,537,592 people shows a moderate negative correlation between the proportion of Immigrants from Trinidad and Tobago and labor force participation rate among population between the ages 20 and 64 in the United States with a correlation coefficient (R) of -0.492 and weighted average of 78.8%, a difference of 0.35%.
In Labor Force | Age 20-64 Correlation Summary
| Measurement | Central American | Immigrants from Trinidad and Tobago |
| Minimum | 67.1% | 38.6% |
| Maximum | 91.6% | 94.0% |
| Range | 24.5% | 55.4% |
| Mean | 79.7% | 79.1% |
| Median | 79.6% | 79.6% |
| Interquartile 25% (IQ1) | 78.2% | 78.1% |
| Interquartile 75% (IQ3) | 82.2% | 81.7% |
| Interquartile Range (IQR) | 4.0% | 3.7% |
| Standard Deviation (Sample) | 4.3% | 6.1% |
| Standard Deviation (Population) | 4.2% | 6.1% |
Demographics Similar to Central Americans and Immigrants from Trinidad and Tobago by In Labor Force | Age 20-64
In terms of in labor force | age 20-64, the demographic groups most similar to Central Americans are Immigrants from Western Europe (79.1%, a difference of 0.0%), Panamanian (79.1%, a difference of 0.010%), Alsatian (79.1%, a difference of 0.010%), Native Hawaiian (79.1%, a difference of 0.010%), and Lebanese (79.1%, a difference of 0.030%). Similarly, the demographic groups most similar to Immigrants from Trinidad and Tobago are Scottish (78.9%, a difference of 0.030%), French (78.9%, a difference of 0.060%), Immigrants from West Indies (78.9%, a difference of 0.090%), Jamaican (78.9%, a difference of 0.12%), and Immigrants from Micronesia (78.9%, a difference of 0.12%).
| Demographics | Rating | Rank | In Labor Force | Age 20-64 |
| Central Americans | 5.9 /100 | #226 | Tragic 79.1% |
| Immigrants | Western Europe | 5.9 /100 | #227 | Tragic 79.1% |
| Panamanians | 5.7 /100 | #228 | Tragic 79.1% |
| Alsatians | 5.7 /100 | #229 | Tragic 79.1% |
| Native Hawaiians | 5.6 /100 | #230 | Tragic 79.1% |
| Lebanese | 5.1 /100 | #231 | Tragic 79.1% |
| Guamanians/Chamorros | 4.5 /100 | #232 | Tragic 79.1% |
| Japanese | 4.0 /100 | #233 | Tragic 79.1% |
| Immigrants | Canada | 3.2 /100 | #234 | Tragic 79.0% |
| Tlingit-Haida | 3.2 /100 | #235 | Tragic 79.0% |
| Samoans | 2.9 /100 | #236 | Tragic 79.0% |
| Immigrants | North America | 2.9 /100 | #237 | Tragic 79.0% |
| Immigrants | Jamaica | 2.6 /100 | #238 | Tragic 79.0% |
| Welsh | 2.4 /100 | #239 | Tragic 79.0% |
| Trinidadians and Tobagonians | 2.3 /100 | #240 | Tragic 79.0% |
| Jamaicans | 2.0 /100 | #241 | Tragic 78.9% |
| Immigrants | Micronesia | 1.9 /100 | #242 | Tragic 78.9% |
| Immigrants | West Indies | 1.7 /100 | #243 | Tragic 78.9% |
| French | 1.5 /100 | #244 | Tragic 78.9% |
| Scottish | 1.3 /100 | #245 | Tragic 78.9% |
| Immigrants | Trinidad and Tobago | 1.1 /100 | #246 | Tragic 78.8% |