German Russian vs Immigrants from Trinidad and Tobago In Labor Force | Age 20-64
COMPARE
German Russian
Immigrants from Trinidad and Tobago
In Labor Force | Age 20-64
In Labor Force | Age 20-64 Comparison
German Russians
Immigrants from Trinidad and Tobago
80.1%
IN LABOR FORCE | AGE 20-64
97.3/ 100
METRIC RATING
81st/ 347
METRIC RANK
78.8%
IN LABOR FORCE | AGE 20-64
1.1/ 100
METRIC RATING
246th/ 347
METRIC RANK
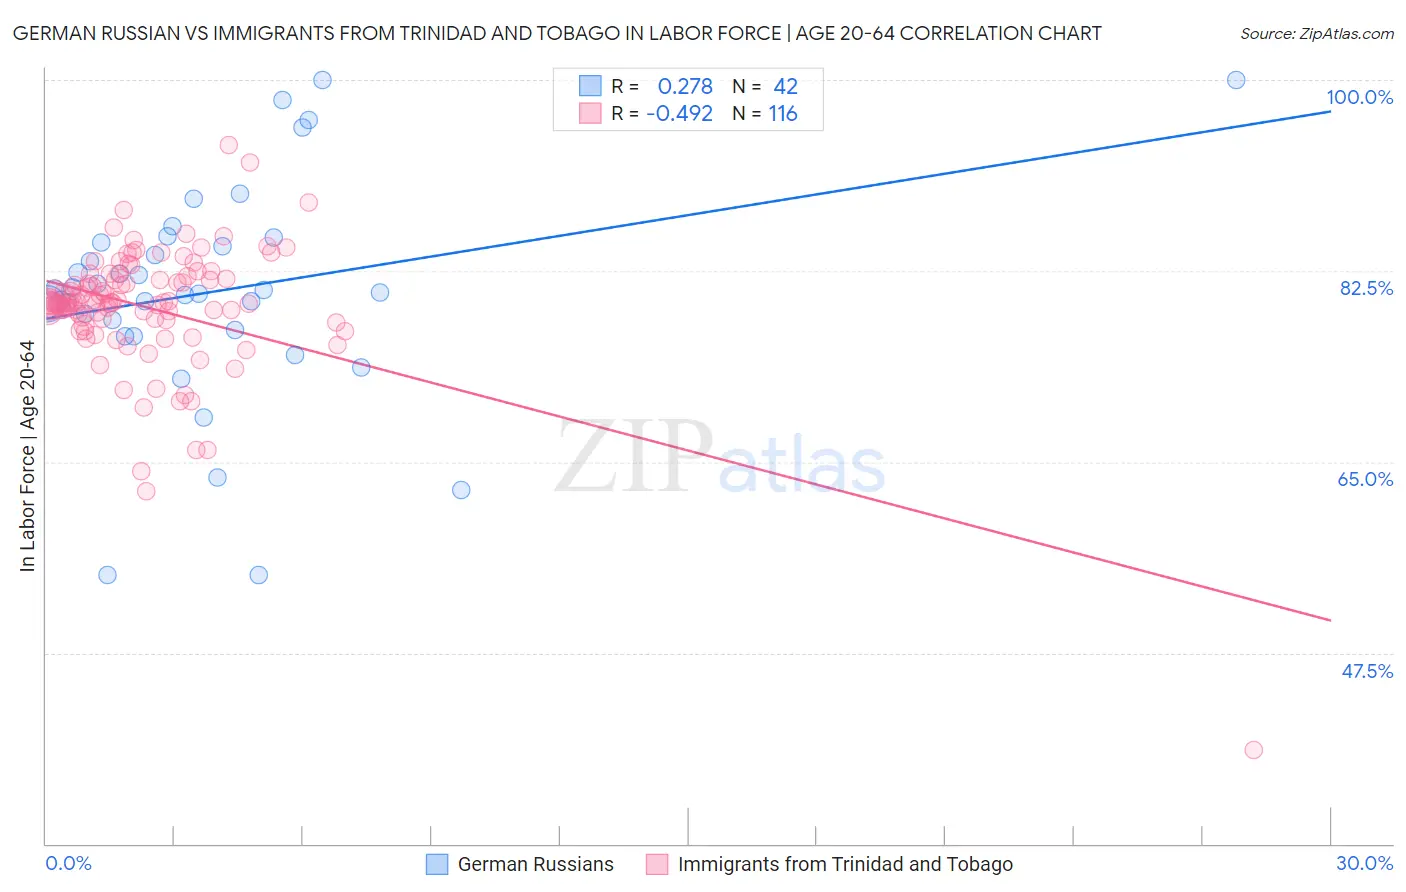
German Russian vs Immigrants from Trinidad and Tobago In Labor Force | Age 20-64 Correlation Chart
The statistical analysis conducted on geographies consisting of 96,458,963 people shows a weak positive correlation between the proportion of German Russians and labor force participation rate among population between the ages 20 and 64 in the United States with a correlation coefficient (R) of 0.278 and weighted average of 80.1%. Similarly, the statistical analysis conducted on geographies consisting of 223,537,592 people shows a moderate negative correlation between the proportion of Immigrants from Trinidad and Tobago and labor force participation rate among population between the ages 20 and 64 in the United States with a correlation coefficient (R) of -0.492 and weighted average of 78.8%, a difference of 1.6%.
In Labor Force | Age 20-64 Correlation Summary
| Measurement | German Russian | Immigrants from Trinidad and Tobago |
| Minimum | 54.6% | 38.6% |
| Maximum | 100.0% | 94.0% |
| Range | 45.4% | 55.4% |
| Mean | 80.6% | 79.1% |
| Median | 80.7% | 79.6% |
| Interquartile 25% (IQ1) | 77.1% | 78.1% |
| Interquartile 75% (IQ3) | 85.1% | 81.7% |
| Interquartile Range (IQR) | 8.0% | 3.7% |
| Standard Deviation (Sample) | 10.1% | 6.1% |
| Standard Deviation (Population) | 9.9% | 6.1% |
Similar Demographics by In Labor Force | Age 20-64
Demographics Similar to German Russians by In Labor Force | Age 20-64
In terms of in labor force | age 20-64, the demographic groups most similar to German Russians are Immigrants from Japan (80.1%, a difference of 0.0%), Colombian (80.1%, a difference of 0.0%), Immigrants from Latvia (80.1%, a difference of 0.010%), Jordanian (80.1%, a difference of 0.010%), and Immigrants from Egypt (80.1%, a difference of 0.010%).
| Demographics | Rating | Rank | In Labor Force | Age 20-64 |
| Immigrants | Eastern Europe | 98.1 /100 | #74 | Exceptional 80.2% |
| Immigrants | Afghanistan | 97.9 /100 | #75 | Exceptional 80.2% |
| Egyptians | 97.8 /100 | #76 | Exceptional 80.2% |
| Immigrants | Colombia | 97.8 /100 | #77 | Exceptional 80.2% |
| Immigrants | Romania | 97.8 /100 | #78 | Exceptional 80.2% |
| Asians | 97.7 /100 | #79 | Exceptional 80.2% |
| Immigrants | Croatia | 97.6 /100 | #80 | Exceptional 80.1% |
| German Russians | 97.3 /100 | #81 | Exceptional 80.1% |
| Immigrants | Japan | 97.3 /100 | #82 | Exceptional 80.1% |
| Colombians | 97.3 /100 | #83 | Exceptional 80.1% |
| Immigrants | Latvia | 97.2 /100 | #84 | Exceptional 80.1% |
| Jordanians | 97.2 /100 | #85 | Exceptional 80.1% |
| Immigrants | Egypt | 97.1 /100 | #86 | Exceptional 80.1% |
| Croatians | 97.1 /100 | #87 | Exceptional 80.1% |
| Chileans | 97.0 /100 | #88 | Exceptional 80.1% |
Demographics Similar to Immigrants from Trinidad and Tobago by In Labor Force | Age 20-64
In terms of in labor force | age 20-64, the demographic groups most similar to Immigrants from Trinidad and Tobago are Immigrants from Germany (78.8%, a difference of 0.020%), Immigrants from Caribbean (78.8%, a difference of 0.020%), Scottish (78.9%, a difference of 0.030%), English (78.8%, a difference of 0.050%), and French (78.9%, a difference of 0.060%).
| Demographics | Rating | Rank | In Labor Force | Age 20-64 |
| Welsh | 2.4 /100 | #239 | Tragic 79.0% |
| Trinidadians and Tobagonians | 2.3 /100 | #240 | Tragic 79.0% |
| Jamaicans | 2.0 /100 | #241 | Tragic 78.9% |
| Immigrants | Micronesia | 1.9 /100 | #242 | Tragic 78.9% |
| Immigrants | West Indies | 1.7 /100 | #243 | Tragic 78.9% |
| French | 1.5 /100 | #244 | Tragic 78.9% |
| Scottish | 1.3 /100 | #245 | Tragic 78.9% |
| Immigrants | Trinidad and Tobago | 1.1 /100 | #246 | Tragic 78.8% |
| Immigrants | Germany | 1.0 /100 | #247 | Tragic 78.8% |
| Immigrants | Caribbean | 1.0 /100 | #248 | Tragic 78.8% |
| English | 0.9 /100 | #249 | Tragic 78.8% |
| Hondurans | 0.8 /100 | #250 | Tragic 78.8% |
| Barbadians | 0.7 /100 | #251 | Tragic 78.8% |
| Immigrants | Honduras | 0.6 /100 | #252 | Tragic 78.7% |
| Basques | 0.5 /100 | #253 | Tragic 78.7% |