Immigrants from Germany vs Austrian In Labor Force | Age 35-44
COMPARE
Immigrants from Germany
Austrian
In Labor Force | Age 35-44
In Labor Force | Age 35-44 Comparison
Immigrants from Germany
Austrians
83.9%
IN LABOR FORCE | AGE 35-44
2.8/ 100
METRIC RATING
233rd/ 347
METRIC RANK
84.7%
IN LABOR FORCE | AGE 35-44
89.4/ 100
METRIC RATING
132nd/ 347
METRIC RANK
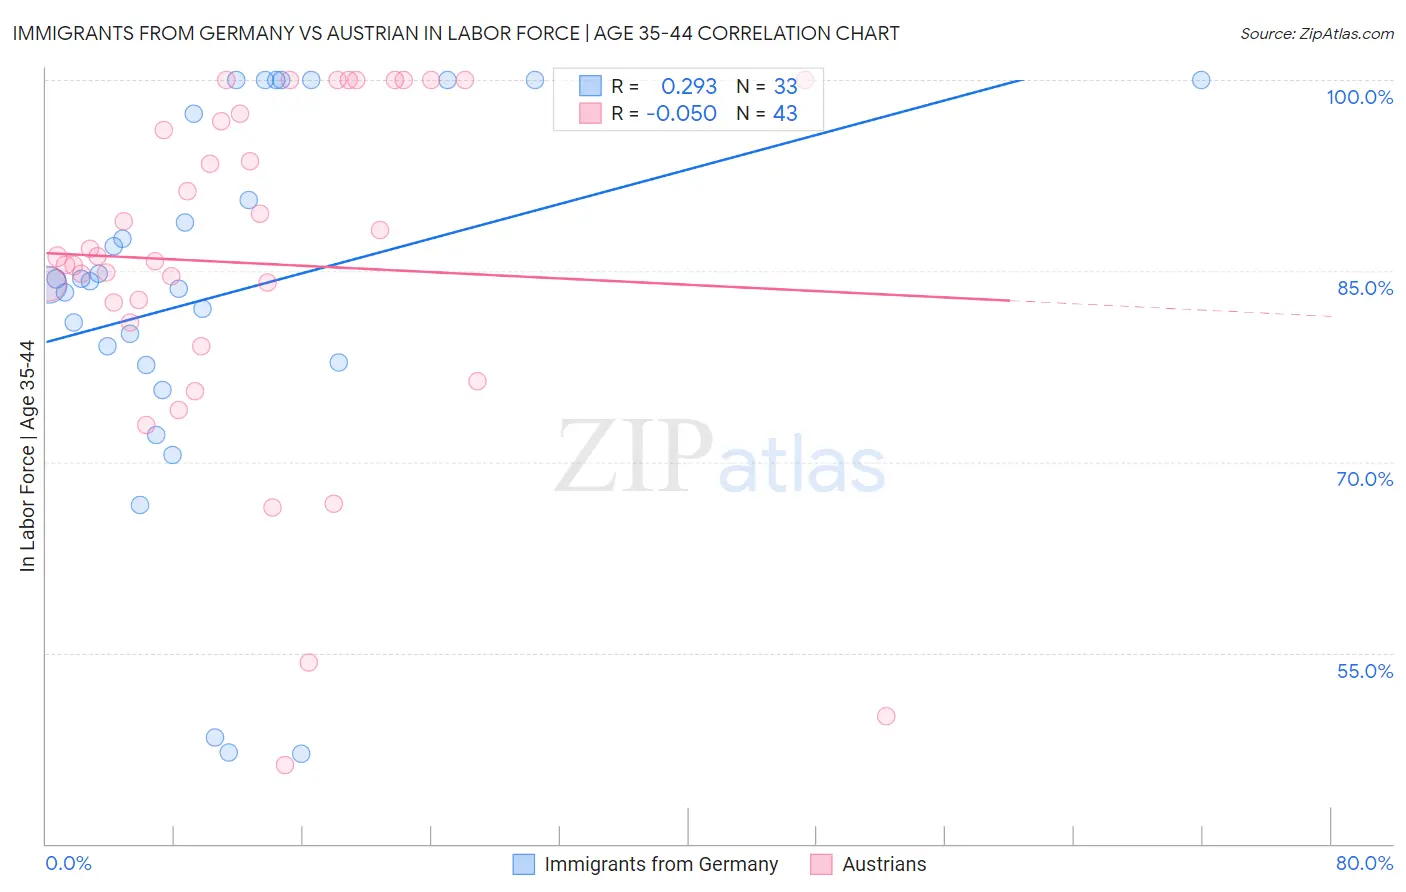
Immigrants from Germany vs Austrian In Labor Force | Age 35-44 Correlation Chart
The statistical analysis conducted on geographies consisting of 463,742,889 people shows a weak positive correlation between the proportion of Immigrants from Germany and labor force participation rate among population between the ages 35 and 44 in the United States with a correlation coefficient (R) of 0.293 and weighted average of 83.9%. Similarly, the statistical analysis conducted on geographies consisting of 451,816,853 people shows a slight negative correlation between the proportion of Austrians and labor force participation rate among population between the ages 35 and 44 in the United States with a correlation coefficient (R) of -0.050 and weighted average of 84.7%, a difference of 0.92%.
In Labor Force | Age 35-44 Correlation Summary
| Measurement | Immigrants from Germany | Austrian |
| Minimum | 47.1% | 46.2% |
| Maximum | 100.0% | 100.0% |
| Range | 52.9% | 53.8% |
| Mean | 83.2% | 85.6% |
| Median | 84.2% | 86.1% |
| Interquartile 25% (IQ1) | 77.7% | 81.0% |
| Interquartile 75% (IQ3) | 98.7% | 97.4% |
| Interquartile Range (IQR) | 21.0% | 16.4% |
| Standard Deviation (Sample) | 14.9% | 13.6% |
| Standard Deviation (Population) | 14.7% | 13.4% |
Similar Demographics by In Labor Force | Age 35-44
Demographics Similar to Immigrants from Germany by In Labor Force | Age 35-44
In terms of in labor force | age 35-44, the demographic groups most similar to Immigrants from Germany are Native Hawaiian (83.9%, a difference of 0.010%), Immigrants from Oceania (83.9%, a difference of 0.010%), Scottish (83.9%, a difference of 0.020%), Immigrants from Syria (83.9%, a difference of 0.020%), and West Indian (83.9%, a difference of 0.030%).
| Demographics | Rating | Rank | In Labor Force | Age 35-44 |
| Panamanians | 5.4 /100 | #226 | Tragic 84.0% |
| British West Indians | 5.3 /100 | #227 | Tragic 84.0% |
| Welsh | 5.3 /100 | #228 | Tragic 84.0% |
| Immigrants | Thailand | 4.7 /100 | #229 | Tragic 84.0% |
| Immigrants | Iraq | 3.7 /100 | #230 | Tragic 83.9% |
| Scottish | 3.2 /100 | #231 | Tragic 83.9% |
| Native Hawaiians | 3.0 /100 | #232 | Tragic 83.9% |
| Immigrants | Germany | 2.8 /100 | #233 | Tragic 83.9% |
| Immigrants | Oceania | 2.6 /100 | #234 | Tragic 83.9% |
| Immigrants | Syria | 2.5 /100 | #235 | Tragic 83.9% |
| West Indians | 2.4 /100 | #236 | Tragic 83.9% |
| English | 1.8 /100 | #237 | Tragic 83.8% |
| Immigrants | Laos | 1.7 /100 | #238 | Tragic 83.8% |
| Celtics | 1.4 /100 | #239 | Tragic 83.8% |
| Arabs | 1.3 /100 | #240 | Tragic 83.8% |
Demographics Similar to Austrians by In Labor Force | Age 35-44
In terms of in labor force | age 35-44, the demographic groups most similar to Austrians are Palestinian (84.7%, a difference of 0.0%), Bhutanese (84.7%, a difference of 0.0%), Immigrants from Scotland (84.7%, a difference of 0.0%), Maltese (84.7%, a difference of 0.020%), and Asian (84.7%, a difference of 0.020%).
| Demographics | Rating | Rank | In Labor Force | Age 35-44 |
| Maltese | 90.8 /100 | #125 | Exceptional 84.7% |
| Asians | 90.6 /100 | #126 | Exceptional 84.7% |
| Immigrants | Spain | 90.6 /100 | #127 | Exceptional 84.7% |
| Immigrants | Ghana | 90.4 /100 | #128 | Exceptional 84.7% |
| Palestinians | 89.7 /100 | #129 | Excellent 84.7% |
| Bhutanese | 89.7 /100 | #130 | Excellent 84.7% |
| Immigrants | Scotland | 89.6 /100 | #131 | Excellent 84.7% |
| Austrians | 89.4 /100 | #132 | Excellent 84.7% |
| Argentineans | 88.4 /100 | #133 | Excellent 84.6% |
| Immigrants | Korea | 88.2 /100 | #134 | Excellent 84.6% |
| Immigrants | Malaysia | 87.5 /100 | #135 | Excellent 84.6% |
| Afghans | 86.3 /100 | #136 | Excellent 84.6% |
| Immigrants | Chile | 84.6 /100 | #137 | Excellent 84.6% |
| Czechoslovakians | 82.6 /100 | #138 | Excellent 84.6% |
| Immigrants | Zaire | 82.5 /100 | #139 | Excellent 84.6% |