Jordanian vs Lithuanian In Labor Force | Age > 16
COMPARE
Jordanian
Lithuanian
In Labor Force | Age > 16
In Labor Force | Age > 16 Comparison
Jordanians
Lithuanians
66.3%
IN LABOR FORCE | AGE > 16
99.8/ 100
METRIC RATING
66th/ 347
METRIC RANK
64.8%
IN LABOR FORCE | AGE > 16
17.4/ 100
METRIC RATING
206th/ 347
METRIC RANK
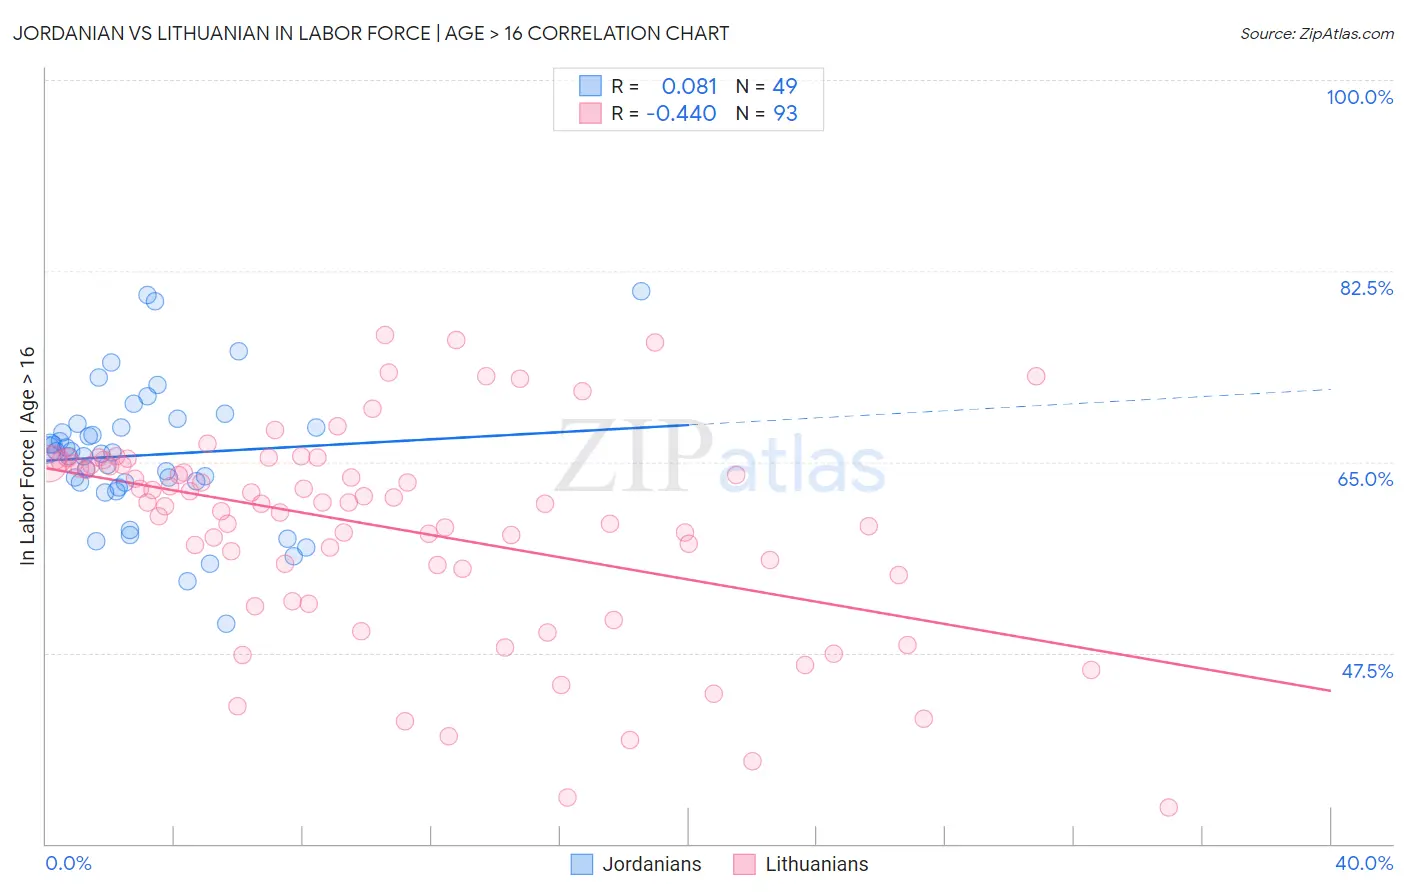
Jordanian vs Lithuanian In Labor Force | Age > 16 Correlation Chart
The statistical analysis conducted on geographies consisting of 166,424,117 people shows a slight positive correlation between the proportion of Jordanians and labor force participation rate among population ages 16 and over in the United States with a correlation coefficient (R) of 0.081 and weighted average of 66.3%. Similarly, the statistical analysis conducted on geographies consisting of 421,961,459 people shows a moderate negative correlation between the proportion of Lithuanians and labor force participation rate among population ages 16 and over in the United States with a correlation coefficient (R) of -0.440 and weighted average of 64.8%, a difference of 2.2%.
In Labor Force | Age > 16 Correlation Summary
| Measurement | Jordanian | Lithuanian |
| Minimum | 50.2% | 33.3% |
| Maximum | 80.6% | 76.6% |
| Range | 30.4% | 43.3% |
| Mean | 65.6% | 59.0% |
| Median | 65.8% | 61.2% |
| Interquartile 25% (IQ1) | 62.8% | 54.9% |
| Interquartile 75% (IQ3) | 68.3% | 64.8% |
| Interquartile Range (IQR) | 5.5% | 9.9% |
| Standard Deviation (Sample) | 6.3% | 9.4% |
| Standard Deviation (Population) | 6.3% | 9.4% |
Similar Demographics by In Labor Force | Age > 16
Demographics Similar to Jordanians by In Labor Force | Age > 16
In terms of in labor force | age > 16, the demographic groups most similar to Jordanians are Sri Lankan (66.3%, a difference of 0.020%), Egyptian (66.2%, a difference of 0.020%), Venezuelan (66.3%, a difference of 0.030%), Peruvian (66.3%, a difference of 0.030%), and Immigrants from Peru (66.3%, a difference of 0.070%).
| Demographics | Rating | Rank | In Labor Force | Age > 16 |
| Immigrants | Turkey | 99.9 /100 | #59 | Exceptional 66.3% |
| Immigrants | Peru | 99.8 /100 | #60 | Exceptional 66.3% |
| Immigrants | Burma/Myanmar | 99.8 /100 | #61 | Exceptional 66.3% |
| Indonesians | 99.8 /100 | #62 | Exceptional 66.3% |
| Venezuelans | 99.8 /100 | #63 | Exceptional 66.3% |
| Peruvians | 99.8 /100 | #64 | Exceptional 66.3% |
| Sri Lankans | 99.8 /100 | #65 | Exceptional 66.3% |
| Jordanians | 99.8 /100 | #66 | Exceptional 66.3% |
| Egyptians | 99.8 /100 | #67 | Exceptional 66.2% |
| Immigrants | Egypt | 99.7 /100 | #68 | Exceptional 66.2% |
| Sub-Saharan Africans | 99.7 /100 | #69 | Exceptional 66.2% |
| Asians | 99.7 /100 | #70 | Exceptional 66.2% |
| Burmese | 99.7 /100 | #71 | Exceptional 66.2% |
| Taiwanese | 99.7 /100 | #72 | Exceptional 66.2% |
| Immigrants | Vietnam | 99.7 /100 | #73 | Exceptional 66.2% |
Demographics Similar to Lithuanians by In Labor Force | Age > 16
In terms of in labor force | age > 16, the demographic groups most similar to Lithuanians are Immigrants from Latin America (64.8%, a difference of 0.020%), Belizean (64.8%, a difference of 0.020%), Russian (64.9%, a difference of 0.030%), Slovene (64.9%, a difference of 0.030%), and Jamaican (64.9%, a difference of 0.030%).
| Demographics | Rating | Rank | In Labor Force | Age > 16 |
| Mexican American Indians | 23.1 /100 | #199 | Fair 64.9% |
| Armenians | 20.2 /100 | #200 | Fair 64.9% |
| Ukrainians | 19.6 /100 | #201 | Poor 64.9% |
| Immigrants | Belgium | 19.4 /100 | #202 | Poor 64.9% |
| Russians | 18.8 /100 | #203 | Poor 64.9% |
| Slovenes | 18.7 /100 | #204 | Poor 64.9% |
| Jamaicans | 18.7 /100 | #205 | Poor 64.9% |
| Lithuanians | 17.4 /100 | #206 | Poor 64.8% |
| Immigrants | Latin America | 16.4 /100 | #207 | Poor 64.8% |
| Belizeans | 16.2 /100 | #208 | Poor 64.8% |
| Immigrants | Trinidad and Tobago | 15.6 /100 | #209 | Poor 64.8% |
| Immigrants | Denmark | 14.7 /100 | #210 | Poor 64.8% |
| Fijians | 14.1 /100 | #211 | Poor 64.8% |
| Alaskan Athabascans | 13.9 /100 | #212 | Poor 64.8% |
| Maltese | 13.8 /100 | #213 | Poor 64.8% |