Jordanian vs Immigrants from Ghana In Labor Force | Age > 16
COMPARE
Jordanian
Immigrants from Ghana
In Labor Force | Age > 16
In Labor Force | Age > 16 Comparison
Jordanians
Immigrants from Ghana
66.3%
IN LABOR FORCE | AGE > 16
99.8/ 100
METRIC RATING
66th/ 347
METRIC RANK
67.1%
IN LABOR FORCE | AGE > 16
100.0/ 100
METRIC RATING
34th/ 347
METRIC RANK
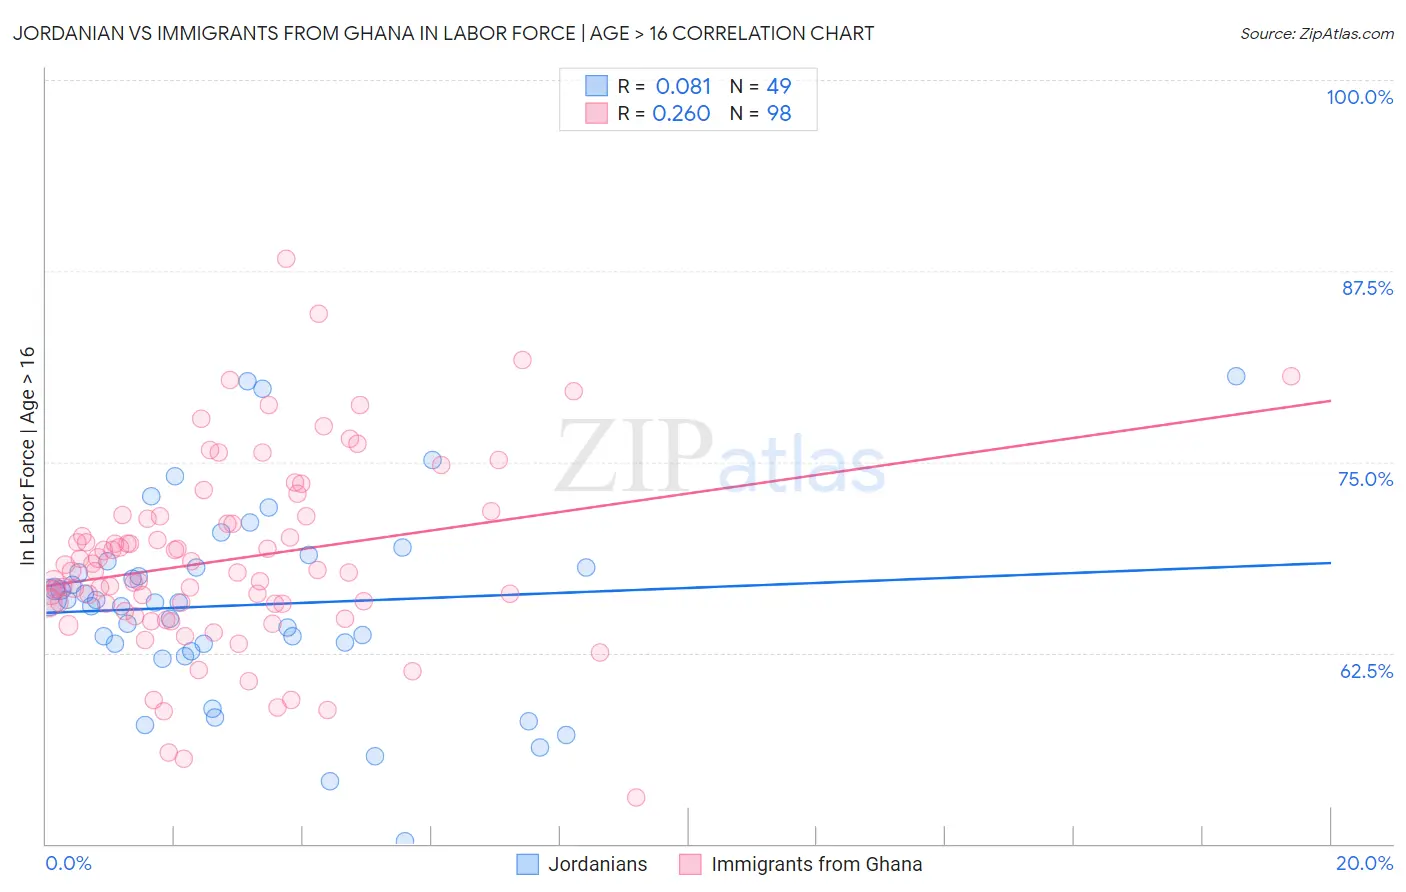
Jordanian vs Immigrants from Ghana In Labor Force | Age > 16 Correlation Chart
The statistical analysis conducted on geographies consisting of 166,424,117 people shows a slight positive correlation between the proportion of Jordanians and labor force participation rate among population ages 16 and over in the United States with a correlation coefficient (R) of 0.081 and weighted average of 66.3%. Similarly, the statistical analysis conducted on geographies consisting of 199,965,359 people shows a weak positive correlation between the proportion of Immigrants from Ghana and labor force participation rate among population ages 16 and over in the United States with a correlation coefficient (R) of 0.260 and weighted average of 67.1%, a difference of 1.3%.
In Labor Force | Age > 16 Correlation Summary
| Measurement | Jordanian | Immigrants from Ghana |
| Minimum | 50.2% | 53.0% |
| Maximum | 80.6% | 88.3% |
| Range | 30.4% | 35.3% |
| Mean | 65.6% | 68.6% |
| Median | 65.8% | 67.9% |
| Interquartile 25% (IQ1) | 62.8% | 65.7% |
| Interquartile 75% (IQ3) | 68.3% | 71.4% |
| Interquartile Range (IQR) | 5.5% | 5.7% |
| Standard Deviation (Sample) | 6.3% | 6.2% |
| Standard Deviation (Population) | 6.3% | 6.1% |
Similar Demographics by In Labor Force | Age > 16
Demographics Similar to Jordanians by In Labor Force | Age > 16
In terms of in labor force | age > 16, the demographic groups most similar to Jordanians are Sri Lankan (66.3%, a difference of 0.020%), Egyptian (66.2%, a difference of 0.020%), Venezuelan (66.3%, a difference of 0.030%), Peruvian (66.3%, a difference of 0.030%), and Immigrants from Peru (66.3%, a difference of 0.070%).
| Demographics | Rating | Rank | In Labor Force | Age > 16 |
| Immigrants | Turkey | 99.9 /100 | #59 | Exceptional 66.3% |
| Immigrants | Peru | 99.8 /100 | #60 | Exceptional 66.3% |
| Immigrants | Burma/Myanmar | 99.8 /100 | #61 | Exceptional 66.3% |
| Indonesians | 99.8 /100 | #62 | Exceptional 66.3% |
| Venezuelans | 99.8 /100 | #63 | Exceptional 66.3% |
| Peruvians | 99.8 /100 | #64 | Exceptional 66.3% |
| Sri Lankans | 99.8 /100 | #65 | Exceptional 66.3% |
| Jordanians | 99.8 /100 | #66 | Exceptional 66.3% |
| Egyptians | 99.8 /100 | #67 | Exceptional 66.2% |
| Immigrants | Egypt | 99.7 /100 | #68 | Exceptional 66.2% |
| Sub-Saharan Africans | 99.7 /100 | #69 | Exceptional 66.2% |
| Asians | 99.7 /100 | #70 | Exceptional 66.2% |
| Burmese | 99.7 /100 | #71 | Exceptional 66.2% |
| Taiwanese | 99.7 /100 | #72 | Exceptional 66.2% |
| Immigrants | Vietnam | 99.7 /100 | #73 | Exceptional 66.2% |
Demographics Similar to Immigrants from Ghana by In Labor Force | Age > 16
In terms of in labor force | age > 16, the demographic groups most similar to Immigrants from Ghana are Afghan (67.1%, a difference of 0.010%), Immigrants from Congo (67.1%, a difference of 0.020%), Immigrants from South Central Asia (67.1%, a difference of 0.050%), Immigrants from Western Africa (67.1%, a difference of 0.050%), and Ghanaian (67.1%, a difference of 0.070%).
| Demographics | Rating | Rank | In Labor Force | Age > 16 |
| Zimbabweans | 100.0 /100 | #27 | Exceptional 67.3% |
| Immigrants | Morocco | 100.0 /100 | #28 | Exceptional 67.2% |
| Thais | 100.0 /100 | #29 | Exceptional 67.2% |
| Immigrants | Zaire | 100.0 /100 | #30 | Exceptional 67.2% |
| Ghanaians | 100.0 /100 | #31 | Exceptional 67.1% |
| Immigrants | Congo | 100.0 /100 | #32 | Exceptional 67.1% |
| Afghans | 100.0 /100 | #33 | Exceptional 67.1% |
| Immigrants | Ghana | 100.0 /100 | #34 | Exceptional 67.1% |
| Immigrants | South Central Asia | 100.0 /100 | #35 | Exceptional 67.1% |
| Immigrants | Western Africa | 100.0 /100 | #36 | Exceptional 67.1% |
| Immigrants | Afghanistan | 100.0 /100 | #37 | Exceptional 67.0% |
| Immigrants | Nigeria | 100.0 /100 | #38 | Exceptional 66.9% |
| Salvadorans | 100.0 /100 | #39 | Exceptional 66.8% |
| Immigrants | El Salvador | 100.0 /100 | #40 | Exceptional 66.8% |
| Immigrants | Zimbabwe | 100.0 /100 | #41 | Exceptional 66.8% |