Immigrants from Sudan vs Hungarian In Labor Force | Age 30-34
COMPARE
Immigrants from Sudan
Hungarian
In Labor Force | Age 30-34
In Labor Force | Age 30-34 Comparison
Immigrants from Sudan
Hungarians
84.8%
IN LABOR FORCE | AGE 30-34
69.5/ 100
METRIC RATING
155th/ 347
METRIC RANK
84.5%
IN LABOR FORCE | AGE 30-34
24.8/ 100
METRIC RATING
191st/ 347
METRIC RANK
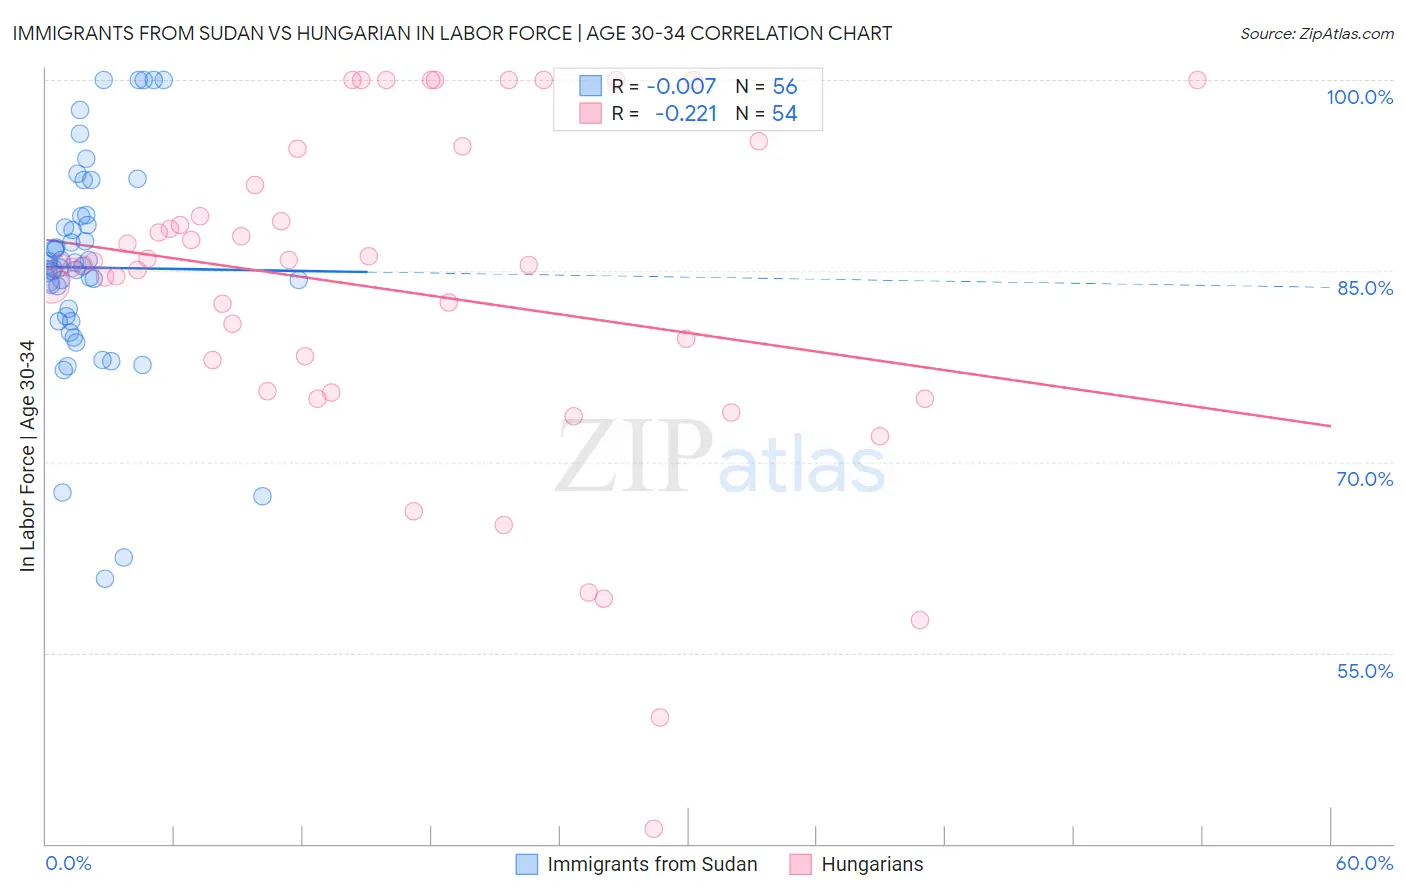
Immigrants from Sudan vs Hungarian In Labor Force | Age 30-34 Correlation Chart
The statistical analysis conducted on geographies consisting of 118,954,607 people shows no correlation between the proportion of Immigrants from Sudan and labor force participation rate among population between the ages 30 and 34 in the United States with a correlation coefficient (R) of -0.007 and weighted average of 84.8%. Similarly, the statistical analysis conducted on geographies consisting of 485,743,554 people shows a weak negative correlation between the proportion of Hungarians and labor force participation rate among population between the ages 30 and 34 in the United States with a correlation coefficient (R) of -0.221 and weighted average of 84.5%, a difference of 0.34%.
In Labor Force | Age 30-34 Correlation Summary
| Measurement | Immigrants from Sudan | Hungarian |
| Minimum | 60.8% | 41.2% |
| Maximum | 100.0% | 100.0% |
| Range | 39.2% | 58.8% |
| Mean | 85.3% | 83.5% |
| Median | 85.3% | 85.5% |
| Interquartile 25% (IQ1) | 81.2% | 75.6% |
| Interquartile 75% (IQ3) | 89.0% | 91.7% |
| Interquartile Range (IQR) | 7.8% | 16.1% |
| Standard Deviation (Sample) | 8.4% | 13.4% |
| Standard Deviation (Population) | 8.3% | 13.2% |
Similar Demographics by In Labor Force | Age 30-34
Demographics Similar to Immigrants from Sudan by In Labor Force | Age 30-34
In terms of in labor force | age 30-34, the demographic groups most similar to Immigrants from Sudan are Syrian (84.8%, a difference of 0.0%), Northern European (84.8%, a difference of 0.0%), French Canadian (84.8%, a difference of 0.020%), Romanian (84.8%, a difference of 0.030%), and Peruvian (84.8%, a difference of 0.030%).
| Demographics | Rating | Rank | In Labor Force | Age 30-34 |
| Immigrants | Pakistan | 76.2 /100 | #148 | Good 84.9% |
| Immigrants | Ukraine | 75.1 /100 | #149 | Good 84.8% |
| Germans | 75.1 /100 | #150 | Good 84.8% |
| Immigrants | Senegal | 74.0 /100 | #151 | Good 84.8% |
| Romanians | 73.5 /100 | #152 | Good 84.8% |
| Syrians | 70.1 /100 | #153 | Good 84.8% |
| Northern Europeans | 70.0 /100 | #154 | Good 84.8% |
| Immigrants | Sudan | 69.5 /100 | #155 | Good 84.8% |
| French Canadians | 67.3 /100 | #156 | Good 84.8% |
| Peruvians | 65.9 /100 | #157 | Good 84.8% |
| Immigrants | Armenia | 64.7 /100 | #158 | Good 84.8% |
| Czechoslovakians | 63.0 /100 | #159 | Good 84.8% |
| Pakistanis | 60.8 /100 | #160 | Good 84.7% |
| Immigrants | Cambodia | 60.7 /100 | #161 | Good 84.7% |
| South Americans | 58.7 /100 | #162 | Average 84.7% |
Demographics Similar to Hungarians by In Labor Force | Age 30-34
In terms of in labor force | age 30-34, the demographic groups most similar to Hungarians are Scandinavian (84.5%, a difference of 0.0%), Immigrants from Zaire (84.5%, a difference of 0.010%), Immigrants from Costa Rica (84.5%, a difference of 0.010%), Immigrants from Afghanistan (84.5%, a difference of 0.010%), and Korean (84.5%, a difference of 0.020%).
| Demographics | Rating | Rank | In Labor Force | Age 30-34 |
| Immigrants | North America | 33.3 /100 | #184 | Fair 84.6% |
| Immigrants | Philippines | 31.5 /100 | #185 | Fair 84.6% |
| Immigrants | Congo | 29.7 /100 | #186 | Fair 84.6% |
| Costa Ricans | 29.6 /100 | #187 | Fair 84.6% |
| Taiwanese | 29.4 /100 | #188 | Fair 84.6% |
| Nigerians | 28.9 /100 | #189 | Fair 84.5% |
| Immigrants | Zaire | 25.8 /100 | #190 | Fair 84.5% |
| Hungarians | 24.8 /100 | #191 | Fair 84.5% |
| Scandinavians | 24.7 /100 | #192 | Fair 84.5% |
| Immigrants | Costa Rica | 23.9 /100 | #193 | Fair 84.5% |
| Immigrants | Afghanistan | 23.5 /100 | #194 | Fair 84.5% |
| Koreans | 23.2 /100 | #195 | Fair 84.5% |
| British | 22.9 /100 | #196 | Fair 84.5% |
| Immigrants | Syria | 21.9 /100 | #197 | Fair 84.5% |
| Dutch | 20.2 /100 | #198 | Fair 84.5% |