Haitian vs Hungarian In Labor Force | Age 30-34
COMPARE
Haitian
Hungarian
In Labor Force | Age 30-34
In Labor Force | Age 30-34 Comparison
Haitians
Hungarians
84.1%
IN LABOR FORCE | AGE 30-34
1.8/ 100
METRIC RATING
234th/ 347
METRIC RANK
84.5%
IN LABOR FORCE | AGE 30-34
24.8/ 100
METRIC RATING
191st/ 347
METRIC RANK
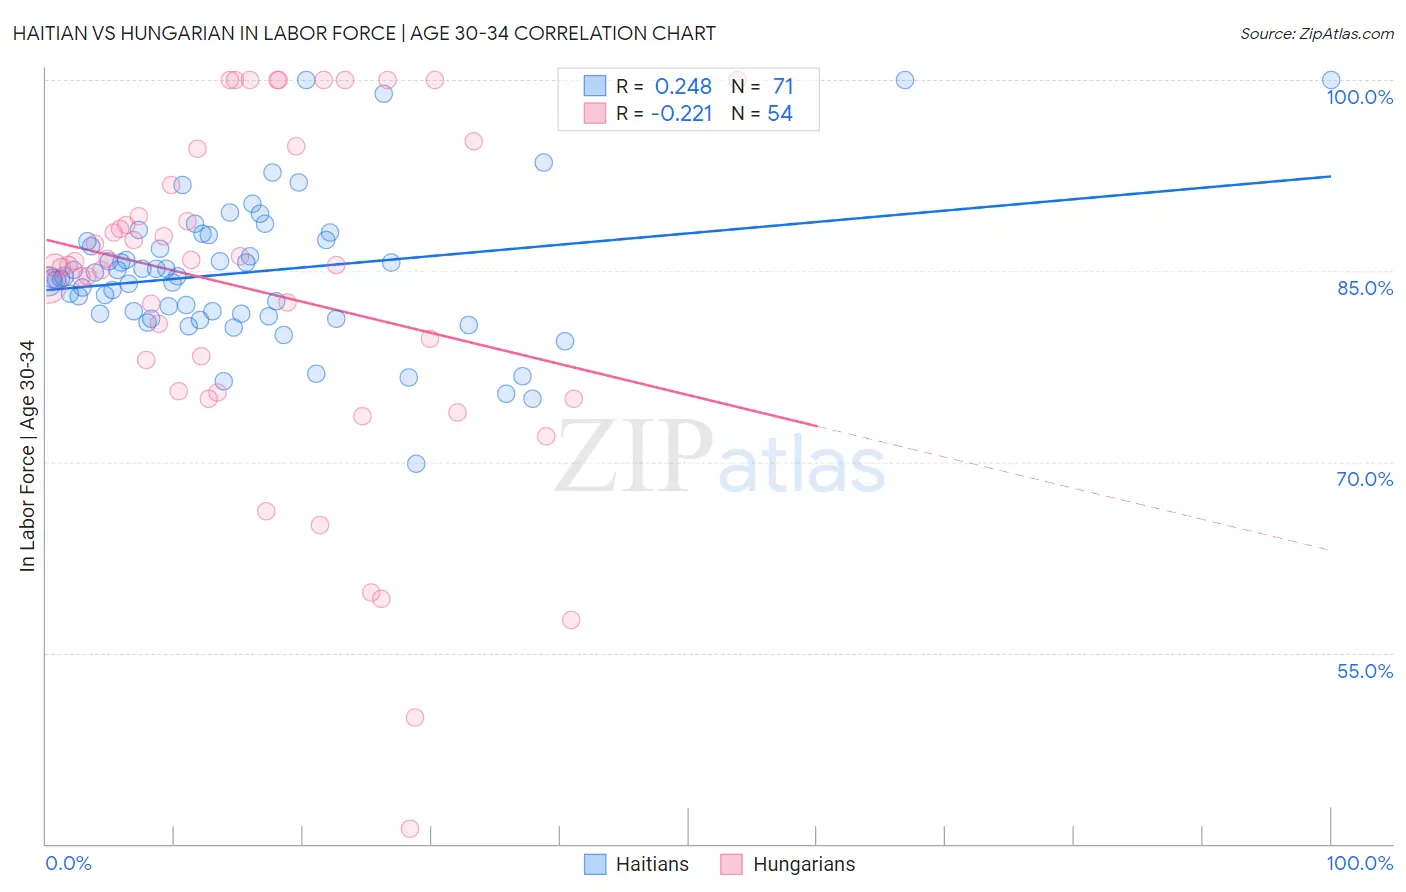
Haitian vs Hungarian In Labor Force | Age 30-34 Correlation Chart
The statistical analysis conducted on geographies consisting of 287,776,350 people shows a weak positive correlation between the proportion of Haitians and labor force participation rate among population between the ages 30 and 34 in the United States with a correlation coefficient (R) of 0.248 and weighted average of 84.1%. Similarly, the statistical analysis conducted on geographies consisting of 485,743,554 people shows a weak negative correlation between the proportion of Hungarians and labor force participation rate among population between the ages 30 and 34 in the United States with a correlation coefficient (R) of -0.221 and weighted average of 84.5%, a difference of 0.51%.
In Labor Force | Age 30-34 Correlation Summary
| Measurement | Haitian | Hungarian |
| Minimum | 69.8% | 41.2% |
| Maximum | 100.0% | 100.0% |
| Range | 30.2% | 58.8% |
| Mean | 84.9% | 83.5% |
| Median | 84.6% | 85.5% |
| Interquartile 25% (IQ1) | 81.6% | 75.6% |
| Interquartile 75% (IQ3) | 87.4% | 91.7% |
| Interquartile Range (IQR) | 5.8% | 16.1% |
| Standard Deviation (Sample) | 5.6% | 13.4% |
| Standard Deviation (Population) | 5.6% | 13.2% |
Similar Demographics by In Labor Force | Age 30-34
Demographics Similar to Haitians by In Labor Force | Age 30-34
In terms of in labor force | age 30-34, the demographic groups most similar to Haitians are West Indian (84.1%, a difference of 0.010%), French American Indian (84.1%, a difference of 0.010%), Immigrants (84.1%, a difference of 0.020%), U.S. Virgin Islander (84.1%, a difference of 0.030%), and Malaysian (84.1%, a difference of 0.040%).
| Demographics | Rating | Rank | In Labor Force | Age 30-34 |
| Immigrants | Cuba | 3.0 /100 | #227 | Tragic 84.2% |
| Immigrants | Haiti | 2.8 /100 | #228 | Tragic 84.2% |
| Welsh | 2.7 /100 | #229 | Tragic 84.2% |
| Immigrants | Bahamas | 2.6 /100 | #230 | Tragic 84.1% |
| Malaysians | 2.2 /100 | #231 | Tragic 84.1% |
| Immigrants | Immigrants | 2.0 /100 | #232 | Tragic 84.1% |
| West Indians | 1.9 /100 | #233 | Tragic 84.1% |
| Haitians | 1.8 /100 | #234 | Tragic 84.1% |
| French American Indians | 1.7 /100 | #235 | Tragic 84.1% |
| U.S. Virgin Islanders | 1.5 /100 | #236 | Tragic 84.1% |
| Celtics | 1.4 /100 | #237 | Tragic 84.1% |
| Immigrants | Barbados | 1.4 /100 | #238 | Tragic 84.0% |
| English | 1.4 /100 | #239 | Tragic 84.0% |
| Venezuelans | 1.3 /100 | #240 | Tragic 84.0% |
| Immigrants | Portugal | 1.2 /100 | #241 | Tragic 84.0% |
Demographics Similar to Hungarians by In Labor Force | Age 30-34
In terms of in labor force | age 30-34, the demographic groups most similar to Hungarians are Scandinavian (84.5%, a difference of 0.0%), Immigrants from Zaire (84.5%, a difference of 0.010%), Immigrants from Costa Rica (84.5%, a difference of 0.010%), Immigrants from Afghanistan (84.5%, a difference of 0.010%), and Korean (84.5%, a difference of 0.020%).
| Demographics | Rating | Rank | In Labor Force | Age 30-34 |
| Immigrants | North America | 33.3 /100 | #184 | Fair 84.6% |
| Immigrants | Philippines | 31.5 /100 | #185 | Fair 84.6% |
| Immigrants | Congo | 29.7 /100 | #186 | Fair 84.6% |
| Costa Ricans | 29.6 /100 | #187 | Fair 84.6% |
| Taiwanese | 29.4 /100 | #188 | Fair 84.6% |
| Nigerians | 28.9 /100 | #189 | Fair 84.5% |
| Immigrants | Zaire | 25.8 /100 | #190 | Fair 84.5% |
| Hungarians | 24.8 /100 | #191 | Fair 84.5% |
| Scandinavians | 24.7 /100 | #192 | Fair 84.5% |
| Immigrants | Costa Rica | 23.9 /100 | #193 | Fair 84.5% |
| Immigrants | Afghanistan | 23.5 /100 | #194 | Fair 84.5% |
| Koreans | 23.2 /100 | #195 | Fair 84.5% |
| British | 22.9 /100 | #196 | Fair 84.5% |
| Immigrants | Syria | 21.9 /100 | #197 | Fair 84.5% |
| Dutch | 20.2 /100 | #198 | Fair 84.5% |