Immigrants from Nicaragua vs Immigrants from the Azores In Labor Force | Age 16-19
COMPARE
Immigrants from Nicaragua
Immigrants from the Azores
In Labor Force | Age 16-19
In Labor Force | Age 16-19 Comparison
Immigrants from Nicaragua
Immigrants from the Azores
31.6%
IN LABOR FORCE | AGE 16-19
0.0/ 100
METRIC RATING
317th/ 347
METRIC RANK
41.7%
IN LABOR FORCE | AGE 16-19
100.0/ 100
METRIC RATING
36th/ 347
METRIC RANK
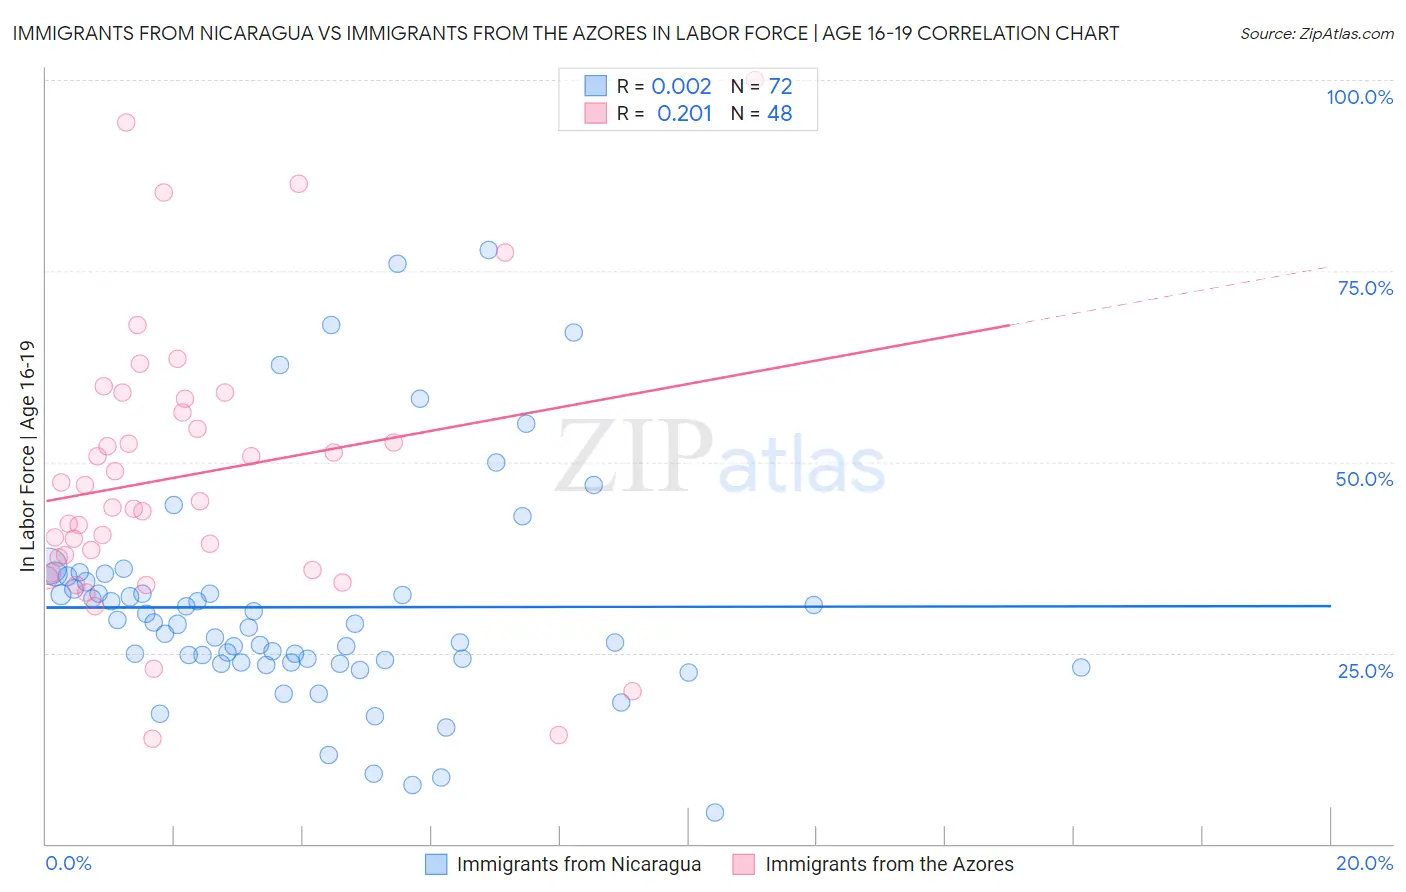
Immigrants from Nicaragua vs Immigrants from the Azores In Labor Force | Age 16-19 Correlation Chart
The statistical analysis conducted on geographies consisting of 236,189,359 people shows no correlation between the proportion of Immigrants from Nicaragua and labor force participation rate among population between the ages 16 and 19 in the United States with a correlation coefficient (R) of 0.002 and weighted average of 31.6%. Similarly, the statistical analysis conducted on geographies consisting of 46,224,998 people shows a weak positive correlation between the proportion of Immigrants from the Azores and labor force participation rate among population between the ages 16 and 19 in the United States with a correlation coefficient (R) of 0.201 and weighted average of 41.7%, a difference of 32.0%.
In Labor Force | Age 16-19 Correlation Summary
| Measurement | Immigrants from Nicaragua | Immigrants from the Azores |
| Minimum | 4.1% | 13.8% |
| Maximum | 77.8% | 100.0% |
| Range | 73.7% | 86.2% |
| Mean | 31.0% | 48.2% |
| Median | 28.5% | 44.4% |
| Interquartile 25% (IQ1) | 23.7% | 36.7% |
| Interquartile 75% (IQ3) | 33.8% | 57.4% |
| Interquartile Range (IQR) | 10.1% | 20.7% |
| Standard Deviation (Sample) | 14.5% | 18.5% |
| Standard Deviation (Population) | 14.4% | 18.3% |
Similar Demographics by In Labor Force | Age 16-19
Demographics Similar to Immigrants from Nicaragua by In Labor Force | Age 16-19
In terms of in labor force | age 16-19, the demographic groups most similar to Immigrants from Nicaragua are Filipino (31.7%, a difference of 0.19%), Immigrants from West Indies (31.7%, a difference of 0.28%), Immigrants from Yemen (31.5%, a difference of 0.34%), Cuban (31.8%, a difference of 0.46%), and Hopi (31.8%, a difference of 0.61%).
| Demographics | Rating | Rank | In Labor Force | Age 16-19 |
| Immigrants | Iran | 0.0 /100 | #310 | Tragic 32.0% |
| Indians (Asian) | 0.0 /100 | #311 | Tragic 31.9% |
| Immigrants | Belize | 0.0 /100 | #312 | Tragic 31.8% |
| Hopi | 0.0 /100 | #313 | Tragic 31.8% |
| Cubans | 0.0 /100 | #314 | Tragic 31.8% |
| Immigrants | West Indies | 0.0 /100 | #315 | Tragic 31.7% |
| Filipinos | 0.0 /100 | #316 | Tragic 31.7% |
| Immigrants | Nicaragua | 0.0 /100 | #317 | Tragic 31.6% |
| Immigrants | Yemen | 0.0 /100 | #318 | Tragic 31.5% |
| Soviet Union | 0.0 /100 | #319 | Tragic 31.4% |
| Ecuadorians | 0.0 /100 | #320 | Tragic 31.4% |
| West Indians | 0.0 /100 | #321 | Tragic 31.3% |
| Tohono O'odham | 0.0 /100 | #322 | Tragic 31.3% |
| Immigrants | Caribbean | 0.0 /100 | #323 | Tragic 31.2% |
| Dominicans | 0.0 /100 | #324 | Tragic 31.2% |
Demographics Similar to Immigrants from the Azores by In Labor Force | Age 16-19
In terms of in labor force | age 16-19, the demographic groups most similar to Immigrants from the Azores are Immigrants from Congo (41.7%, a difference of 0.080%), Yugoslavian (41.8%, a difference of 0.14%), Immigrants from Bosnia and Herzegovina (41.8%, a difference of 0.16%), Liberian (41.8%, a difference of 0.24%), and Czechoslovakian (41.9%, a difference of 0.38%).
| Demographics | Rating | Rank | In Labor Force | Age 16-19 |
| French | 100.0 /100 | #29 | Exceptional 42.1% |
| Scottish | 100.0 /100 | #30 | Exceptional 42.0% |
| Irish | 100.0 /100 | #31 | Exceptional 42.0% |
| Czechoslovakians | 100.0 /100 | #32 | Exceptional 41.9% |
| Liberians | 100.0 /100 | #33 | Exceptional 41.8% |
| Immigrants | Bosnia and Herzegovina | 100.0 /100 | #34 | Exceptional 41.8% |
| Yugoslavians | 100.0 /100 | #35 | Exceptional 41.8% |
| Immigrants | Azores | 100.0 /100 | #36 | Exceptional 41.7% |
| Immigrants | Congo | 100.0 /100 | #37 | Exceptional 41.7% |
| Sioux | 100.0 /100 | #38 | Exceptional 41.5% |
| Scotch-Irish | 100.0 /100 | #39 | Exceptional 41.5% |
| Immigrants | Liberia | 100.0 /100 | #40 | Exceptional 41.5% |
| Celtics | 100.0 /100 | #41 | Exceptional 41.3% |
| Whites/Caucasians | 100.0 /100 | #42 | Exceptional 41.3% |
| Tongans | 100.0 /100 | #43 | Exceptional 41.2% |