Italian vs Albanian In Labor Force | Age 16-19
COMPARE
Italian
Albanian
In Labor Force | Age 16-19
In Labor Force | Age 16-19 Comparison
Italians
Albanians
40.1%
IN LABOR FORCE | AGE 16-19
99.9/ 100
METRIC RATING
68th/ 347
METRIC RANK
36.5%
IN LABOR FORCE | AGE 16-19
48.8/ 100
METRIC RATING
176th/ 347
METRIC RANK
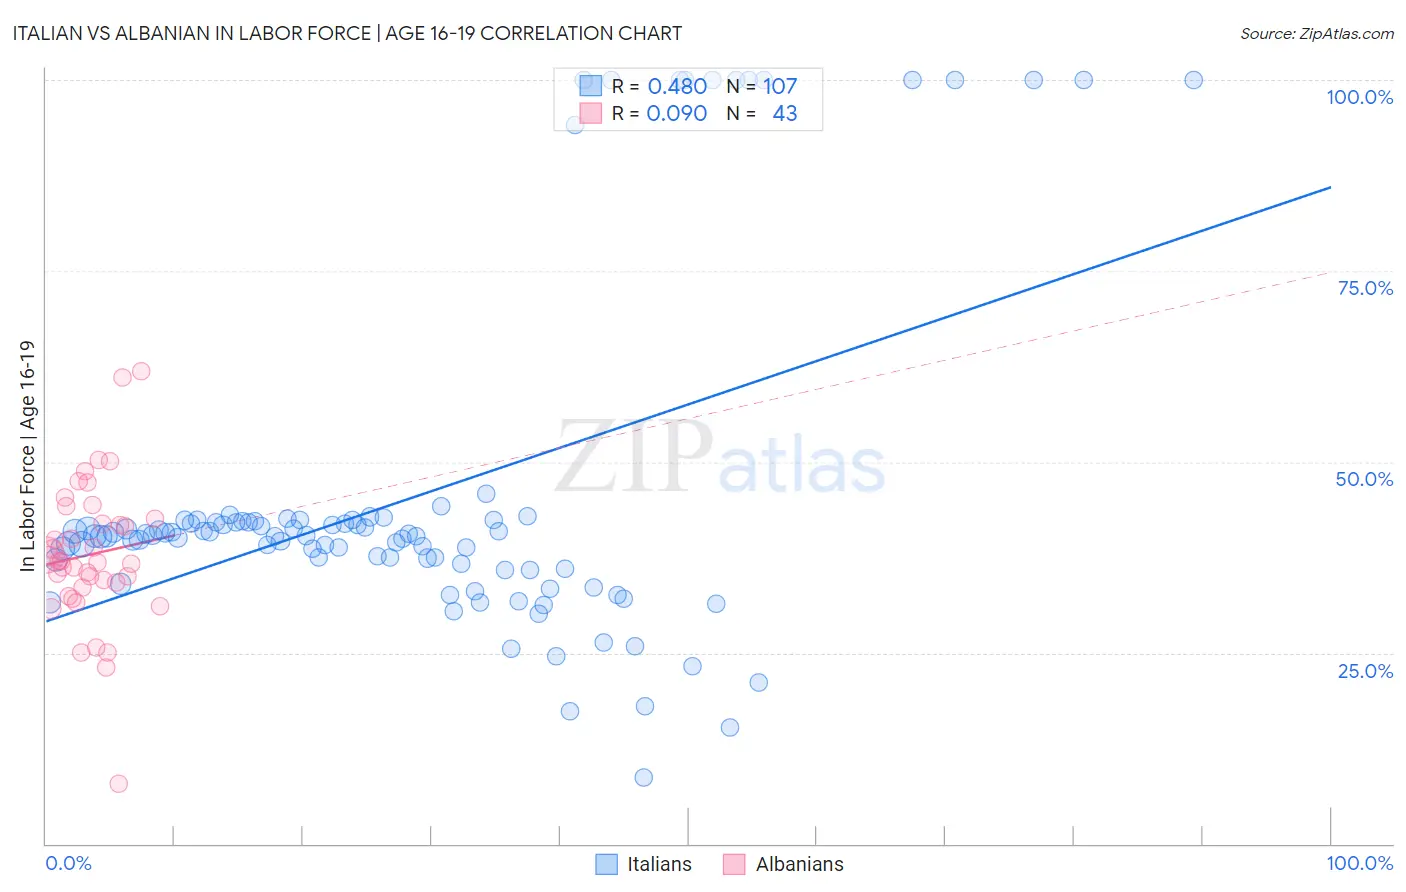
Italian vs Albanian In Labor Force | Age 16-19 Correlation Chart
The statistical analysis conducted on geographies consisting of 570,596,297 people shows a moderate positive correlation between the proportion of Italians and labor force participation rate among population between the ages 16 and 19 in the United States with a correlation coefficient (R) of 0.480 and weighted average of 40.1%. Similarly, the statistical analysis conducted on geographies consisting of 193,105,340 people shows a slight positive correlation between the proportion of Albanians and labor force participation rate among population between the ages 16 and 19 in the United States with a correlation coefficient (R) of 0.090 and weighted average of 36.5%, a difference of 9.6%.
In Labor Force | Age 16-19 Correlation Summary
| Measurement | Italian | Albanian |
| Minimum | 8.6% | 7.8% |
| Maximum | 100.0% | 61.9% |
| Range | 91.4% | 54.1% |
| Mean | 45.2% | 37.9% |
| Median | 40.3% | 37.0% |
| Interquartile 25% (IQ1) | 36.1% | 33.5% |
| Interquartile 75% (IQ3) | 42.3% | 42.5% |
| Interquartile Range (IQR) | 6.2% | 9.0% |
| Standard Deviation (Sample) | 22.2% | 9.5% |
| Standard Deviation (Population) | 22.1% | 9.4% |
Similar Demographics by In Labor Force | Age 16-19
Demographics Similar to Italians by In Labor Force | Age 16-19
In terms of in labor force | age 16-19, the demographic groups most similar to Italians are Canadian (40.1%, a difference of 0.060%), Nonimmigrants (40.1%, a difference of 0.070%), Potawatomi (40.0%, a difference of 0.070%), Portuguese (40.0%, a difference of 0.12%), and Kenyan (40.1%, a difference of 0.19%).
| Demographics | Rating | Rank | In Labor Force | Age 16-19 |
| Americans | 100.0 /100 | #61 | Exceptional 40.3% |
| Cherokee | 100.0 /100 | #62 | Exceptional 40.2% |
| Northern Europeans | 100.0 /100 | #63 | Exceptional 40.2% |
| Immigrants | Micronesia | 100.0 /100 | #64 | Exceptional 40.2% |
| Kenyans | 100.0 /100 | #65 | Exceptional 40.1% |
| Immigrants | Nonimmigrants | 100.0 /100 | #66 | Exceptional 40.1% |
| Canadians | 100.0 /100 | #67 | Exceptional 40.1% |
| Italians | 99.9 /100 | #68 | Exceptional 40.1% |
| Potawatomi | 99.9 /100 | #69 | Exceptional 40.0% |
| Portuguese | 99.9 /100 | #70 | Exceptional 40.0% |
| Serbians | 99.9 /100 | #71 | Exceptional 39.9% |
| Iroquois | 99.9 /100 | #72 | Exceptional 39.9% |
| Immigrants | Middle Africa | 99.9 /100 | #73 | Exceptional 39.9% |
| Hungarians | 99.9 /100 | #74 | Exceptional 39.8% |
| French American Indians | 99.9 /100 | #75 | Exceptional 39.8% |
Demographics Similar to Albanians by In Labor Force | Age 16-19
In terms of in labor force | age 16-19, the demographic groups most similar to Albanians are Native/Alaskan (36.6%, a difference of 0.010%), Immigrants from Czechoslovakia (36.6%, a difference of 0.060%), Immigrants from Northern Europe (36.5%, a difference of 0.11%), Black/African American (36.5%, a difference of 0.19%), and Immigrants from Southern Europe (36.4%, a difference of 0.28%).
| Demographics | Rating | Rank | In Labor Force | Age 16-19 |
| Immigrants | Latvia | 61.6 /100 | #169 | Good 36.8% |
| Immigrants | South Africa | 60.5 /100 | #170 | Good 36.8% |
| Immigrants | Cambodia | 58.4 /100 | #171 | Average 36.7% |
| South Africans | 58.3 /100 | #172 | Average 36.7% |
| Russians | 57.5 /100 | #173 | Average 36.7% |
| Immigrants | Czechoslovakia | 50.0 /100 | #174 | Average 36.6% |
| Natives/Alaskans | 49.0 /100 | #175 | Average 36.6% |
| Albanians | 48.8 /100 | #176 | Average 36.5% |
| Immigrants | Northern Europe | 46.6 /100 | #177 | Average 36.5% |
| Blacks/African Americans | 45.1 /100 | #178 | Average 36.5% |
| Immigrants | Southern Europe | 43.3 /100 | #179 | Average 36.4% |
| Immigrants | Morocco | 41.1 /100 | #180 | Average 36.4% |
| Jordanians | 39.6 /100 | #181 | Fair 36.4% |
| Immigrants | Italy | 39.1 /100 | #182 | Fair 36.4% |
| Eastern Europeans | 38.8 /100 | #183 | Fair 36.4% |