Israeli vs Immigrants from Middle Africa In Labor Force | Age 16-19
COMPARE
Israeli
Immigrants from Middle Africa
In Labor Force | Age 16-19
In Labor Force | Age 16-19 Comparison
Israelis
Immigrants from Middle Africa
32.4%
IN LABOR FORCE | AGE 16-19
0.0/ 100
METRIC RATING
304th/ 347
METRIC RANK
39.9%
IN LABOR FORCE | AGE 16-19
99.9/ 100
METRIC RATING
73rd/ 347
METRIC RANK
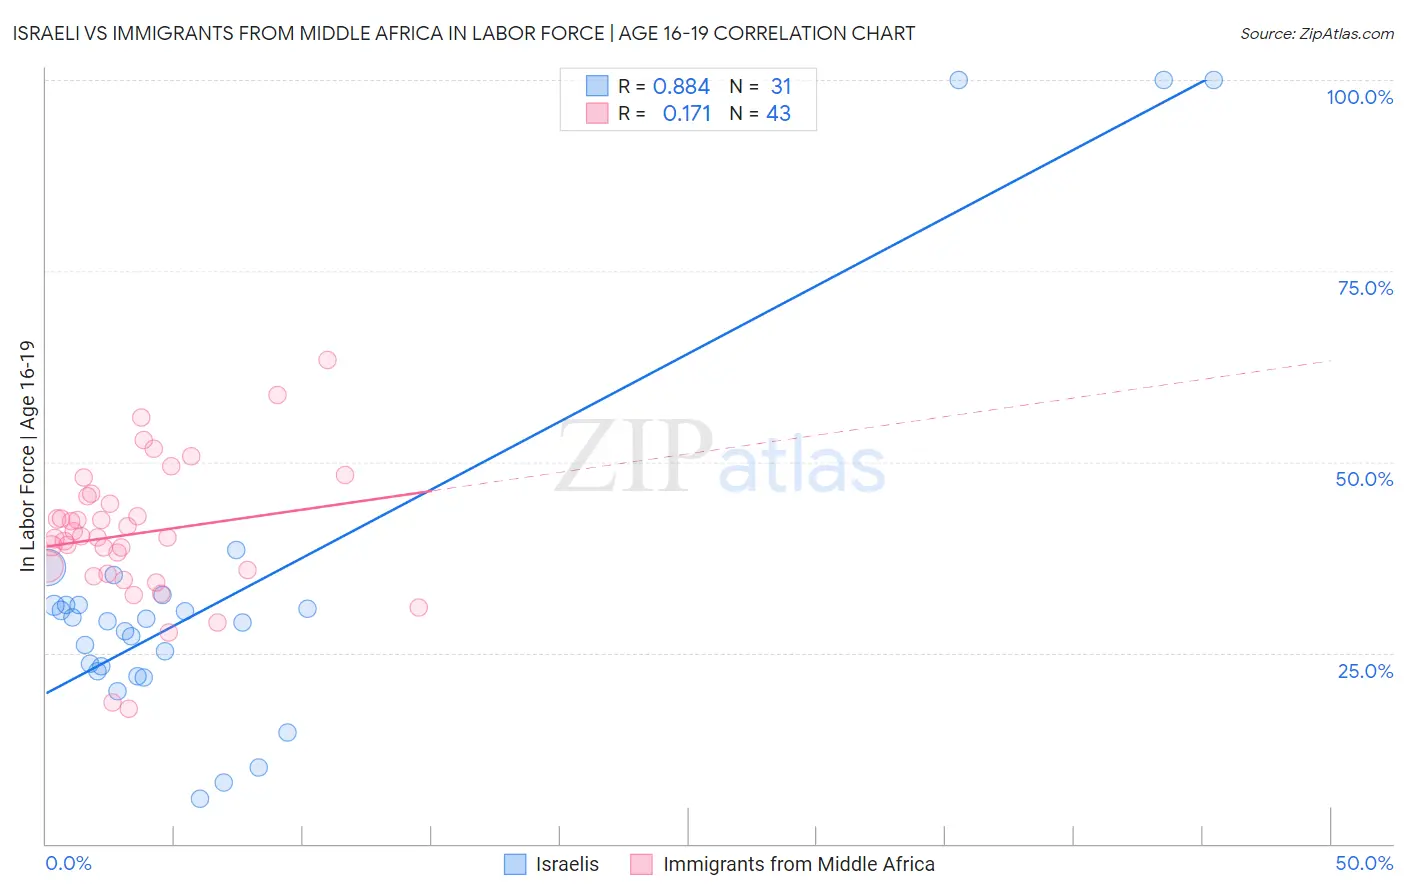
Israeli vs Immigrants from Middle Africa In Labor Force | Age 16-19 Correlation Chart
The statistical analysis conducted on geographies consisting of 210,873,555 people shows a very strong positive correlation between the proportion of Israelis and labor force participation rate among population between the ages 16 and 19 in the United States with a correlation coefficient (R) of 0.884 and weighted average of 32.4%. Similarly, the statistical analysis conducted on geographies consisting of 202,678,432 people shows a poor positive correlation between the proportion of Immigrants from Middle Africa and labor force participation rate among population between the ages 16 and 19 in the United States with a correlation coefficient (R) of 0.171 and weighted average of 39.9%, a difference of 23.2%.
In Labor Force | Age 16-19 Correlation Summary
| Measurement | Israeli | Immigrants from Middle Africa |
| Minimum | 5.9% | 17.7% |
| Maximum | 100.0% | 63.3% |
| Range | 94.1% | 45.6% |
| Mean | 33.0% | 40.6% |
| Median | 29.1% | 40.1% |
| Interquartile 25% (IQ1) | 22.6% | 35.3% |
| Interquartile 75% (IQ3) | 31.3% | 45.4% |
| Interquartile Range (IQR) | 8.8% | 10.1% |
| Standard Deviation (Sample) | 23.6% | 9.1% |
| Standard Deviation (Population) | 23.2% | 9.0% |
Similar Demographics by In Labor Force | Age 16-19
Demographics Similar to Israelis by In Labor Force | Age 16-19
In terms of in labor force | age 16-19, the demographic groups most similar to Israelis are Nicaraguan (32.4%, a difference of 0.050%), Spanish American Indian (32.4%, a difference of 0.18%), Immigrants from Dominica (32.5%, a difference of 0.19%), Immigrants from Jamaica (32.2%, a difference of 0.67%), and Navajo (32.1%, a difference of 1.0%).
| Demographics | Rating | Rank | In Labor Force | Age 16-19 |
| Immigrants | Haiti | 0.1 /100 | #297 | Tragic 33.2% |
| Iranians | 0.0 /100 | #298 | Tragic 33.0% |
| Armenians | 0.0 /100 | #299 | Tragic 32.9% |
| Immigrants | Argentina | 0.0 /100 | #300 | Tragic 32.9% |
| Okinawans | 0.0 /100 | #301 | Tragic 32.8% |
| Belizeans | 0.0 /100 | #302 | Tragic 32.8% |
| Immigrants | Dominica | 0.0 /100 | #303 | Tragic 32.5% |
| Israelis | 0.0 /100 | #304 | Tragic 32.4% |
| Nicaraguans | 0.0 /100 | #305 | Tragic 32.4% |
| Spanish American Indians | 0.0 /100 | #306 | Tragic 32.4% |
| Immigrants | Jamaica | 0.0 /100 | #307 | Tragic 32.2% |
| Navajo | 0.0 /100 | #308 | Tragic 32.1% |
| Immigrants | Eastern Asia | 0.0 /100 | #309 | Tragic 32.0% |
| Immigrants | Iran | 0.0 /100 | #310 | Tragic 32.0% |
| Indians (Asian) | 0.0 /100 | #311 | Tragic 31.9% |
Demographics Similar to Immigrants from Middle Africa by In Labor Force | Age 16-19
In terms of in labor force | age 16-19, the demographic groups most similar to Immigrants from Middle Africa are Iroquois (39.9%, a difference of 0.030%), Serbian (39.9%, a difference of 0.040%), Portuguese (40.0%, a difference of 0.21%), Hungarian (39.8%, a difference of 0.23%), and French American Indian (39.8%, a difference of 0.25%).
| Demographics | Rating | Rank | In Labor Force | Age 16-19 |
| Immigrants | Nonimmigrants | 100.0 /100 | #66 | Exceptional 40.1% |
| Canadians | 100.0 /100 | #67 | Exceptional 40.1% |
| Italians | 99.9 /100 | #68 | Exceptional 40.1% |
| Potawatomi | 99.9 /100 | #69 | Exceptional 40.0% |
| Portuguese | 99.9 /100 | #70 | Exceptional 40.0% |
| Serbians | 99.9 /100 | #71 | Exceptional 39.9% |
| Iroquois | 99.9 /100 | #72 | Exceptional 39.9% |
| Immigrants | Middle Africa | 99.9 /100 | #73 | Exceptional 39.9% |
| Hungarians | 99.9 /100 | #74 | Exceptional 39.8% |
| French American Indians | 99.9 /100 | #75 | Exceptional 39.8% |
| Malaysians | 99.9 /100 | #76 | Exceptional 39.7% |
| Immigrants | Portugal | 99.9 /100 | #77 | Exceptional 39.7% |
| Austrians | 99.8 /100 | #78 | Exceptional 39.5% |
| Marshallese | 99.8 /100 | #79 | Exceptional 39.5% |
| Immigrants | Iraq | 99.8 /100 | #80 | Exceptional 39.4% |