Israeli vs Estonian In Labor Force | Age 16-19
COMPARE
Israeli
Estonian
In Labor Force | Age 16-19
In Labor Force | Age 16-19 Comparison
Israelis
Estonians
32.4%
IN LABOR FORCE | AGE 16-19
0.0/ 100
METRIC RATING
304th/ 347
METRIC RANK
37.7%
IN LABOR FORCE | AGE 16-19
91.7/ 100
METRIC RATING
140th/ 347
METRIC RANK
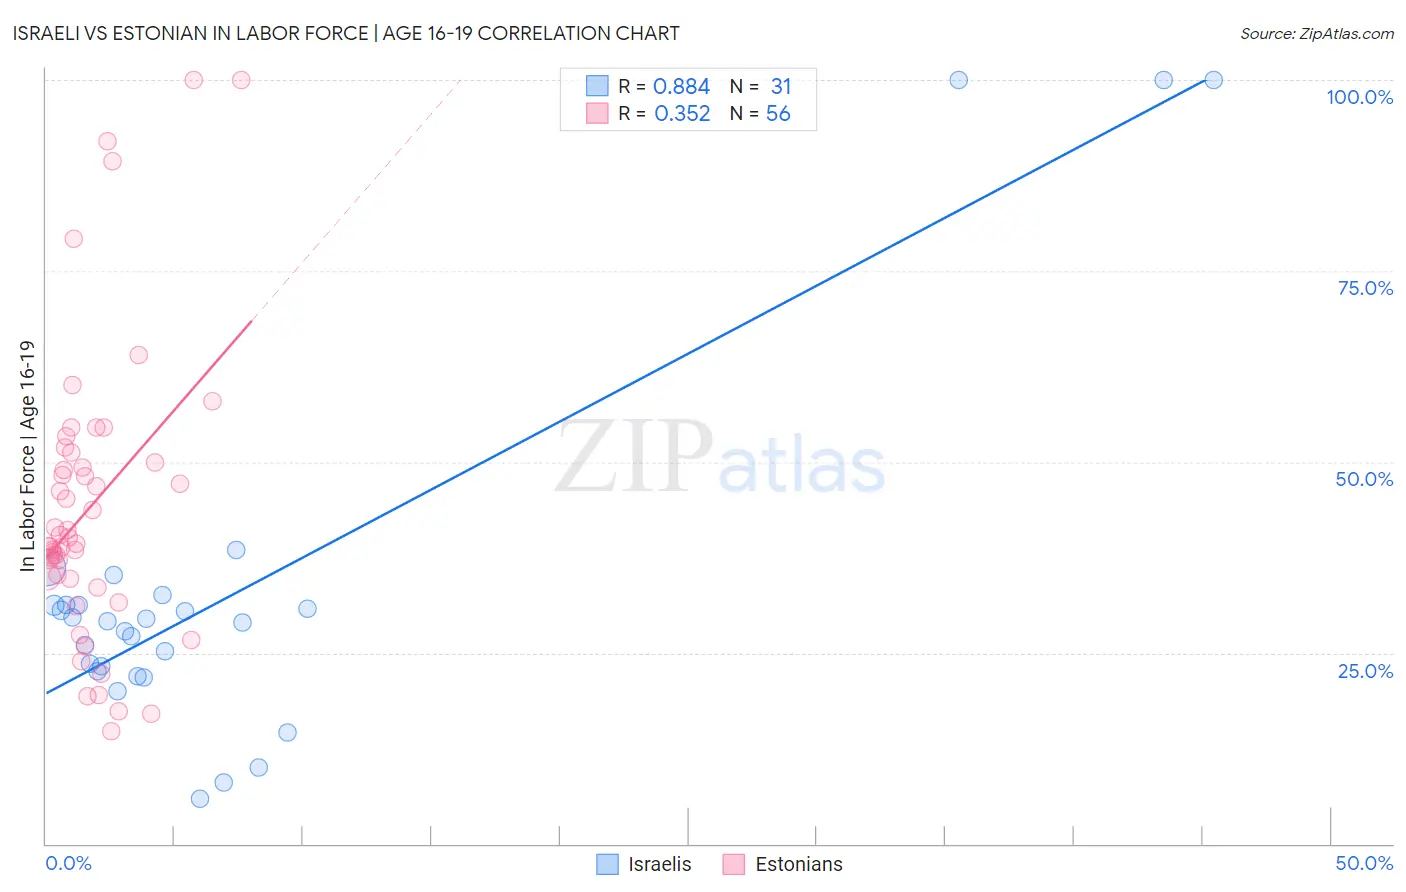
Israeli vs Estonian In Labor Force | Age 16-19 Correlation Chart
The statistical analysis conducted on geographies consisting of 210,873,555 people shows a very strong positive correlation between the proportion of Israelis and labor force participation rate among population between the ages 16 and 19 in the United States with a correlation coefficient (R) of 0.884 and weighted average of 32.4%. Similarly, the statistical analysis conducted on geographies consisting of 123,400,045 people shows a mild positive correlation between the proportion of Estonians and labor force participation rate among population between the ages 16 and 19 in the United States with a correlation coefficient (R) of 0.352 and weighted average of 37.7%, a difference of 16.2%.
In Labor Force | Age 16-19 Correlation Summary
| Measurement | Israeli | Estonian |
| Minimum | 5.9% | 14.8% |
| Maximum | 100.0% | 100.0% |
| Range | 94.1% | 85.2% |
| Mean | 33.0% | 44.2% |
| Median | 29.1% | 39.7% |
| Interquartile 25% (IQ1) | 22.6% | 34.9% |
| Interquartile 75% (IQ3) | 31.3% | 50.6% |
| Interquartile Range (IQR) | 8.8% | 15.8% |
| Standard Deviation (Sample) | 23.6% | 19.0% |
| Standard Deviation (Population) | 23.2% | 18.8% |
Similar Demographics by In Labor Force | Age 16-19
Demographics Similar to Israelis by In Labor Force | Age 16-19
In terms of in labor force | age 16-19, the demographic groups most similar to Israelis are Nicaraguan (32.4%, a difference of 0.050%), Spanish American Indian (32.4%, a difference of 0.18%), Immigrants from Dominica (32.5%, a difference of 0.19%), Immigrants from Jamaica (32.2%, a difference of 0.67%), and Navajo (32.1%, a difference of 1.0%).
| Demographics | Rating | Rank | In Labor Force | Age 16-19 |
| Immigrants | Haiti | 0.1 /100 | #297 | Tragic 33.2% |
| Iranians | 0.0 /100 | #298 | Tragic 33.0% |
| Armenians | 0.0 /100 | #299 | Tragic 32.9% |
| Immigrants | Argentina | 0.0 /100 | #300 | Tragic 32.9% |
| Okinawans | 0.0 /100 | #301 | Tragic 32.8% |
| Belizeans | 0.0 /100 | #302 | Tragic 32.8% |
| Immigrants | Dominica | 0.0 /100 | #303 | Tragic 32.5% |
| Israelis | 0.0 /100 | #304 | Tragic 32.4% |
| Nicaraguans | 0.0 /100 | #305 | Tragic 32.4% |
| Spanish American Indians | 0.0 /100 | #306 | Tragic 32.4% |
| Immigrants | Jamaica | 0.0 /100 | #307 | Tragic 32.2% |
| Navajo | 0.0 /100 | #308 | Tragic 32.1% |
| Immigrants | Eastern Asia | 0.0 /100 | #309 | Tragic 32.0% |
| Immigrants | Iran | 0.0 /100 | #310 | Tragic 32.0% |
| Indians (Asian) | 0.0 /100 | #311 | Tragic 31.9% |
Demographics Similar to Estonians by In Labor Force | Age 16-19
In terms of in labor force | age 16-19, the demographic groups most similar to Estonians are Immigrants from Moldova (37.7%, a difference of 0.030%), Comanche (37.7%, a difference of 0.050%), Syrian (37.6%, a difference of 0.14%), Cajun (37.8%, a difference of 0.27%), and Australian (37.8%, a difference of 0.28%).
| Demographics | Rating | Rank | In Labor Force | Age 16-19 |
| Cheyenne | 94.6 /100 | #133 | Exceptional 37.9% |
| Immigrants | Netherlands | 93.7 /100 | #134 | Exceptional 37.8% |
| Macedonians | 93.4 /100 | #135 | Exceptional 37.8% |
| Australians | 93.2 /100 | #136 | Exceptional 37.8% |
| Cajuns | 93.2 /100 | #137 | Exceptional 37.8% |
| Comanche | 91.9 /100 | #138 | Exceptional 37.7% |
| Immigrants | Moldova | 91.9 /100 | #139 | Exceptional 37.7% |
| Estonians | 91.7 /100 | #140 | Exceptional 37.7% |
| Syrians | 90.7 /100 | #141 | Exceptional 37.6% |
| Sierra Leoneans | 89.7 /100 | #142 | Excellent 37.6% |
| Pakistanis | 89.5 /100 | #143 | Excellent 37.6% |
| Japanese | 89.3 /100 | #144 | Excellent 37.5% |
| Paiute | 89.3 /100 | #145 | Excellent 37.5% |
| Immigrants | Western Europe | 88.9 /100 | #146 | Excellent 37.5% |
| Brazilians | 88.7 /100 | #147 | Excellent 37.5% |