Immigrants from France vs Immigrants from Middle Africa In Labor Force | Age 16-19
COMPARE
Immigrants from France
Immigrants from Middle Africa
In Labor Force | Age 16-19
In Labor Force | Age 16-19 Comparison
Immigrants from France
Immigrants from Middle Africa
35.1%
IN LABOR FORCE | AGE 16-19
4.3/ 100
METRIC RATING
233rd/ 347
METRIC RANK
39.9%
IN LABOR FORCE | AGE 16-19
99.9/ 100
METRIC RATING
73rd/ 347
METRIC RANK
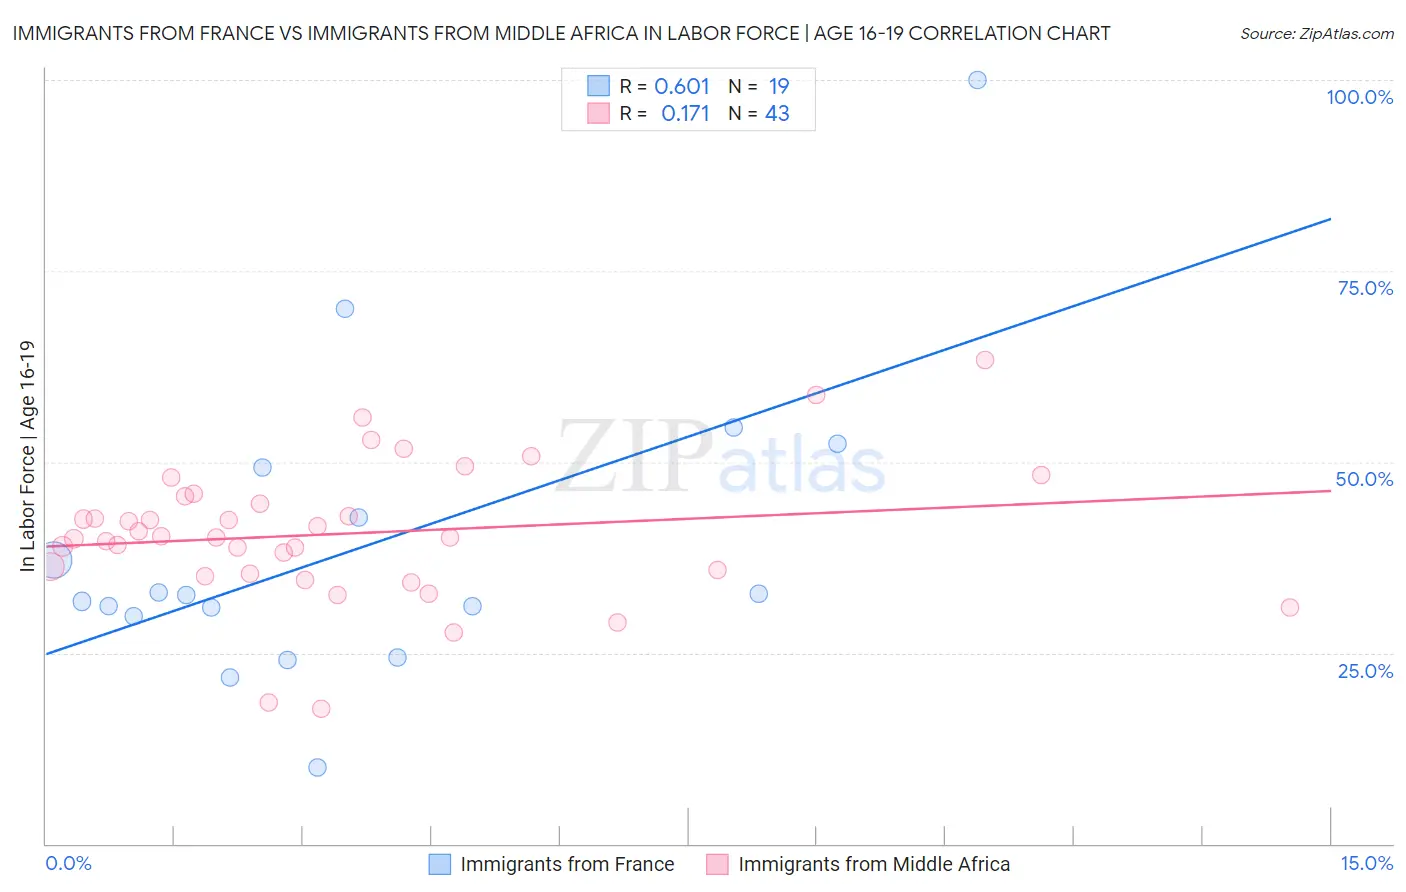
Immigrants from France vs Immigrants from Middle Africa In Labor Force | Age 16-19 Correlation Chart
The statistical analysis conducted on geographies consisting of 287,415,208 people shows a significant positive correlation between the proportion of Immigrants from France and labor force participation rate among population between the ages 16 and 19 in the United States with a correlation coefficient (R) of 0.601 and weighted average of 35.1%. Similarly, the statistical analysis conducted on geographies consisting of 202,678,432 people shows a poor positive correlation between the proportion of Immigrants from Middle Africa and labor force participation rate among population between the ages 16 and 19 in the United States with a correlation coefficient (R) of 0.171 and weighted average of 39.9%, a difference of 13.6%.
In Labor Force | Age 16-19 Correlation Summary
| Measurement | Immigrants from France | Immigrants from Middle Africa |
| Minimum | 9.9% | 17.7% |
| Maximum | 100.0% | 63.3% |
| Range | 90.1% | 45.6% |
| Mean | 38.9% | 40.6% |
| Median | 32.5% | 40.1% |
| Interquartile 25% (IQ1) | 29.8% | 35.3% |
| Interquartile 75% (IQ3) | 49.3% | 45.4% |
| Interquartile Range (IQR) | 19.5% | 10.1% |
| Standard Deviation (Sample) | 20.1% | 9.1% |
| Standard Deviation (Population) | 19.5% | 9.0% |
Similar Demographics by In Labor Force | Age 16-19
Demographics Similar to Immigrants from France by In Labor Force | Age 16-19
In terms of in labor force | age 16-19, the demographic groups most similar to Immigrants from France are Immigrants from Syria (35.2%, a difference of 0.040%), Immigrants from Kazakhstan (35.2%, a difference of 0.040%), Immigrants from Mexico (35.1%, a difference of 0.040%), Immigrants from Philippines (35.1%, a difference of 0.12%), and Immigrants from Honduras (35.2%, a difference of 0.17%).
| Demographics | Rating | Rank | In Labor Force | Age 16-19 |
| Immigrants | Guatemala | 5.7 /100 | #226 | Tragic 35.3% |
| Mongolians | 5.7 /100 | #227 | Tragic 35.3% |
| Immigrants | Senegal | 5.5 /100 | #228 | Tragic 35.3% |
| Immigrants | Lebanon | 5.0 /100 | #229 | Tragic 35.2% |
| Immigrants | Honduras | 4.9 /100 | #230 | Tragic 35.2% |
| Immigrants | Syria | 4.5 /100 | #231 | Tragic 35.2% |
| Immigrants | Kazakhstan | 4.5 /100 | #232 | Tragic 35.2% |
| Immigrants | France | 4.3 /100 | #233 | Tragic 35.1% |
| Immigrants | Mexico | 4.2 /100 | #234 | Tragic 35.1% |
| Immigrants | Philippines | 4.0 /100 | #235 | Tragic 35.1% |
| Immigrants | Australia | 3.6 /100 | #236 | Tragic 35.1% |
| Immigrants | India | 3.5 /100 | #237 | Tragic 35.0% |
| Immigrants | Vietnam | 3.4 /100 | #238 | Tragic 35.0% |
| Inupiat | 3.2 /100 | #239 | Tragic 35.0% |
| Immigrants | Central America | 3.0 /100 | #240 | Tragic 35.0% |
Demographics Similar to Immigrants from Middle Africa by In Labor Force | Age 16-19
In terms of in labor force | age 16-19, the demographic groups most similar to Immigrants from Middle Africa are Iroquois (39.9%, a difference of 0.030%), Serbian (39.9%, a difference of 0.040%), Portuguese (40.0%, a difference of 0.21%), Hungarian (39.8%, a difference of 0.23%), and French American Indian (39.8%, a difference of 0.25%).
| Demographics | Rating | Rank | In Labor Force | Age 16-19 |
| Immigrants | Nonimmigrants | 100.0 /100 | #66 | Exceptional 40.1% |
| Canadians | 100.0 /100 | #67 | Exceptional 40.1% |
| Italians | 99.9 /100 | #68 | Exceptional 40.1% |
| Potawatomi | 99.9 /100 | #69 | Exceptional 40.0% |
| Portuguese | 99.9 /100 | #70 | Exceptional 40.0% |
| Serbians | 99.9 /100 | #71 | Exceptional 39.9% |
| Iroquois | 99.9 /100 | #72 | Exceptional 39.9% |
| Immigrants | Middle Africa | 99.9 /100 | #73 | Exceptional 39.9% |
| Hungarians | 99.9 /100 | #74 | Exceptional 39.8% |
| French American Indians | 99.9 /100 | #75 | Exceptional 39.8% |
| Malaysians | 99.9 /100 | #76 | Exceptional 39.7% |
| Immigrants | Portugal | 99.9 /100 | #77 | Exceptional 39.7% |
| Austrians | 99.8 /100 | #78 | Exceptional 39.5% |
| Marshallese | 99.8 /100 | #79 | Exceptional 39.5% |
| Immigrants | Iraq | 99.8 /100 | #80 | Exceptional 39.4% |