Israeli vs Immigrants from El Salvador In Labor Force | Age 16-19
COMPARE
Israeli
Immigrants from El Salvador
In Labor Force | Age 16-19
In Labor Force | Age 16-19 Comparison
Israelis
Immigrants from El Salvador
32.4%
IN LABOR FORCE | AGE 16-19
0.0/ 100
METRIC RATING
304th/ 347
METRIC RANK
34.3%
IN LABOR FORCE | AGE 16-19
0.7/ 100
METRIC RATING
265th/ 347
METRIC RANK
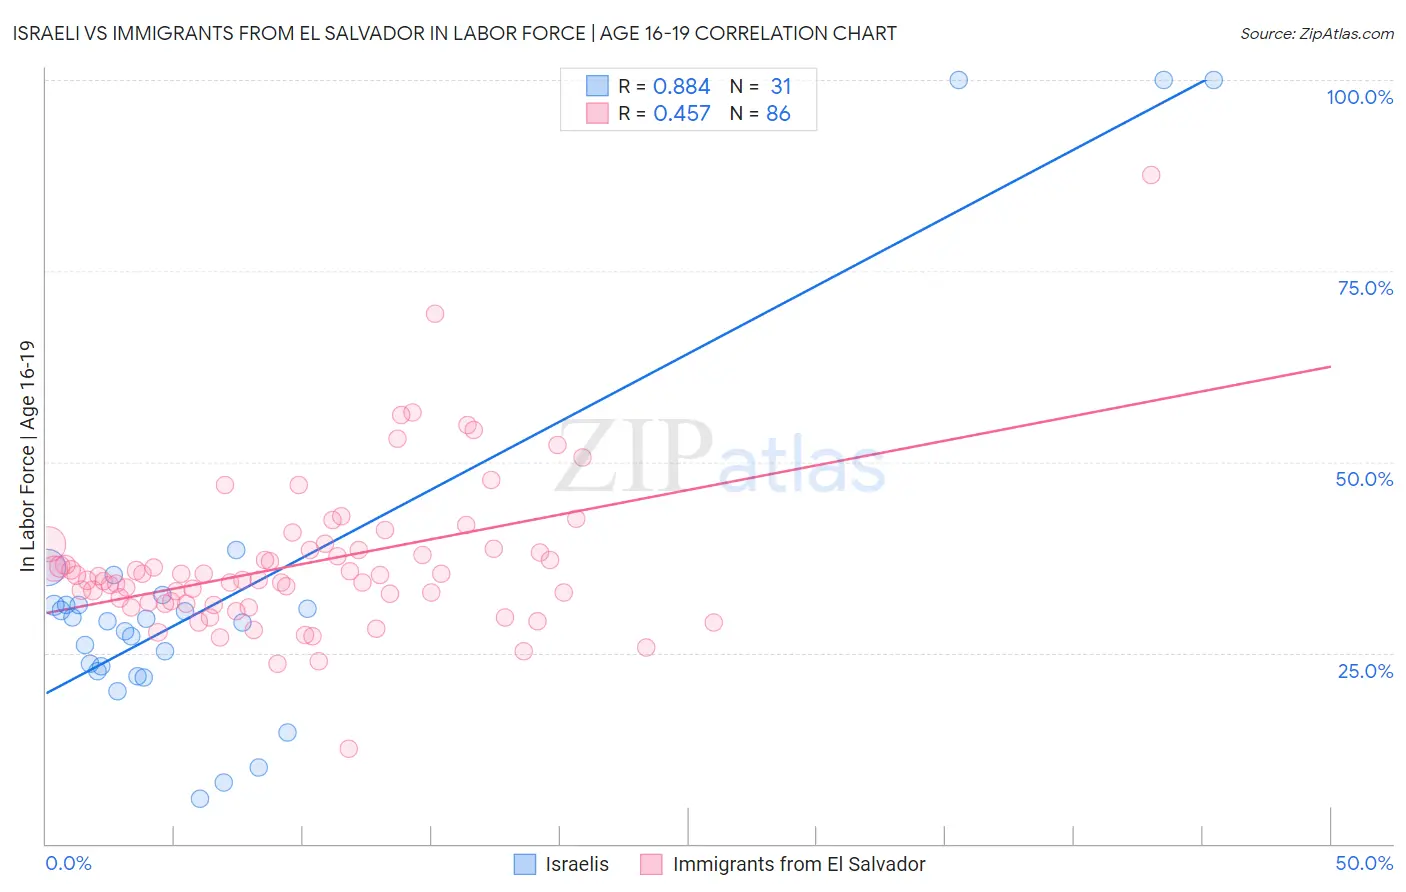
Israeli vs Immigrants from El Salvador In Labor Force | Age 16-19 Correlation Chart
The statistical analysis conducted on geographies consisting of 210,873,555 people shows a very strong positive correlation between the proportion of Israelis and labor force participation rate among population between the ages 16 and 19 in the United States with a correlation coefficient (R) of 0.884 and weighted average of 32.4%. Similarly, the statistical analysis conducted on geographies consisting of 357,322,465 people shows a moderate positive correlation between the proportion of Immigrants from El Salvador and labor force participation rate among population between the ages 16 and 19 in the United States with a correlation coefficient (R) of 0.457 and weighted average of 34.3%, a difference of 5.9%.
In Labor Force | Age 16-19 Correlation Summary
| Measurement | Israeli | Immigrants from El Salvador |
| Minimum | 5.9% | 12.4% |
| Maximum | 100.0% | 87.5% |
| Range | 94.1% | 75.1% |
| Mean | 33.0% | 36.7% |
| Median | 29.1% | 34.8% |
| Interquartile 25% (IQ1) | 22.6% | 31.4% |
| Interquartile 75% (IQ3) | 31.3% | 38.5% |
| Interquartile Range (IQR) | 8.8% | 7.1% |
| Standard Deviation (Sample) | 23.6% | 10.1% |
| Standard Deviation (Population) | 23.2% | 10.0% |
Similar Demographics by In Labor Force | Age 16-19
Demographics Similar to Israelis by In Labor Force | Age 16-19
In terms of in labor force | age 16-19, the demographic groups most similar to Israelis are Nicaraguan (32.4%, a difference of 0.050%), Spanish American Indian (32.4%, a difference of 0.18%), Immigrants from Dominica (32.5%, a difference of 0.19%), Immigrants from Jamaica (32.2%, a difference of 0.67%), and Navajo (32.1%, a difference of 1.0%).
| Demographics | Rating | Rank | In Labor Force | Age 16-19 |
| Immigrants | Haiti | 0.1 /100 | #297 | Tragic 33.2% |
| Iranians | 0.0 /100 | #298 | Tragic 33.0% |
| Armenians | 0.0 /100 | #299 | Tragic 32.9% |
| Immigrants | Argentina | 0.0 /100 | #300 | Tragic 32.9% |
| Okinawans | 0.0 /100 | #301 | Tragic 32.8% |
| Belizeans | 0.0 /100 | #302 | Tragic 32.8% |
| Immigrants | Dominica | 0.0 /100 | #303 | Tragic 32.5% |
| Israelis | 0.0 /100 | #304 | Tragic 32.4% |
| Nicaraguans | 0.0 /100 | #305 | Tragic 32.4% |
| Spanish American Indians | 0.0 /100 | #306 | Tragic 32.4% |
| Immigrants | Jamaica | 0.0 /100 | #307 | Tragic 32.2% |
| Navajo | 0.0 /100 | #308 | Tragic 32.1% |
| Immigrants | Eastern Asia | 0.0 /100 | #309 | Tragic 32.0% |
| Immigrants | Iran | 0.0 /100 | #310 | Tragic 32.0% |
| Indians (Asian) | 0.0 /100 | #311 | Tragic 31.9% |
Demographics Similar to Immigrants from El Salvador by In Labor Force | Age 16-19
In terms of in labor force | age 16-19, the demographic groups most similar to Immigrants from El Salvador are Immigrants from Malaysia (34.3%, a difference of 0.090%), Immigrants from Uruguay (34.4%, a difference of 0.24%), Immigrants from Peru (34.2%, a difference of 0.44%), Burmese (34.5%, a difference of 0.53%), and Immigrants from Asia (34.1%, a difference of 0.56%).
| Demographics | Rating | Rank | In Labor Force | Age 16-19 |
| Thais | 1.2 /100 | #258 | Tragic 34.6% |
| Immigrants | Immigrants | 1.2 /100 | #259 | Tragic 34.6% |
| Egyptians | 1.2 /100 | #260 | Tragic 34.5% |
| Salvadorans | 1.1 /100 | #261 | Tragic 34.5% |
| Hispanics or Latinos | 1.1 /100 | #262 | Tragic 34.5% |
| Burmese | 1.1 /100 | #263 | Tragic 34.5% |
| Immigrants | Uruguay | 0.9 /100 | #264 | Tragic 34.4% |
| Immigrants | El Salvador | 0.7 /100 | #265 | Tragic 34.3% |
| Immigrants | Malaysia | 0.7 /100 | #266 | Tragic 34.3% |
| Immigrants | Peru | 0.5 /100 | #267 | Tragic 34.2% |
| Immigrants | Asia | 0.5 /100 | #268 | Tragic 34.1% |
| Pima | 0.5 /100 | #269 | Tragic 34.1% |
| Immigrants | Russia | 0.4 /100 | #270 | Tragic 34.1% |
| Central American Indians | 0.4 /100 | #271 | Tragic 34.1% |
| Asians | 0.4 /100 | #272 | Tragic 34.1% |