Israeli vs Central American Indian In Labor Force | Age 20-64
COMPARE
Israeli
Central American Indian
In Labor Force | Age 20-64
In Labor Force | Age 20-64 Comparison
Israelis
Central American Indians
79.5%
IN LABOR FORCE | AGE 20-64
34.7/ 100
METRIC RATING
185th/ 347
METRIC RANK
77.1%
IN LABOR FORCE | AGE 20-64
0.0/ 100
METRIC RATING
307th/ 347
METRIC RANK
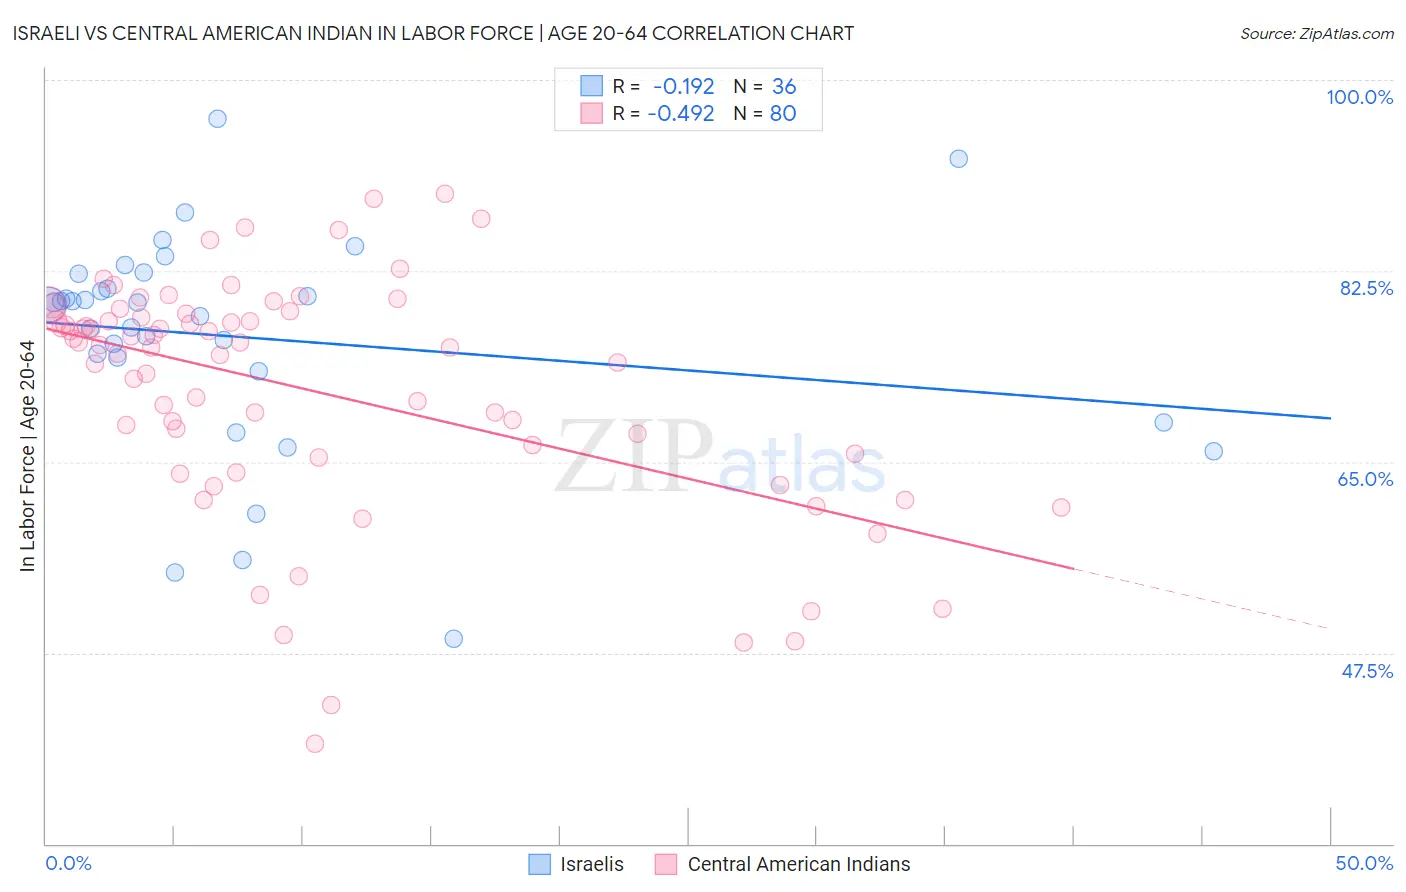
Israeli vs Central American Indian In Labor Force | Age 20-64 Correlation Chart
The statistical analysis conducted on geographies consisting of 211,219,254 people shows a poor negative correlation between the proportion of Israelis and labor force participation rate among population between the ages 20 and 64 in the United States with a correlation coefficient (R) of -0.192 and weighted average of 79.5%. Similarly, the statistical analysis conducted on geographies consisting of 326,143,757 people shows a moderate negative correlation between the proportion of Central American Indians and labor force participation rate among population between the ages 20 and 64 in the United States with a correlation coefficient (R) of -0.492 and weighted average of 77.1%, a difference of 3.1%.
In Labor Force | Age 20-64 Correlation Summary
| Measurement | Israeli | Central American Indian |
| Minimum | 48.8% | 39.2% |
| Maximum | 96.5% | 89.6% |
| Range | 47.7% | 50.4% |
| Mean | 76.4% | 71.6% |
| Median | 79.5% | 75.6% |
| Interquartile 25% (IQ1) | 73.9% | 65.6% |
| Interquartile 75% (IQ3) | 81.6% | 78.4% |
| Interquartile Range (IQR) | 7.6% | 12.7% |
| Standard Deviation (Sample) | 10.0% | 10.9% |
| Standard Deviation (Population) | 9.9% | 10.8% |
Similar Demographics by In Labor Force | Age 20-64
Demographics Similar to Israelis by In Labor Force | Age 20-64
In terms of in labor force | age 20-64, the demographic groups most similar to Israelis are Northern European (79.5%, a difference of 0.0%), Finnish (79.5%, a difference of 0.010%), Assyrian/Chaldean/Syriac (79.4%, a difference of 0.010%), Malaysian (79.5%, a difference of 0.020%), and Immigrants from Hungary (79.5%, a difference of 0.020%).
| Demographics | Rating | Rank | In Labor Force | Age 20-64 |
| Czechoslovakians | 44.3 /100 | #178 | Average 79.5% |
| Armenians | 41.4 /100 | #179 | Average 79.5% |
| Salvadorans | 41.0 /100 | #180 | Average 79.5% |
| Immigrants | Saudi Arabia | 37.7 /100 | #181 | Fair 79.5% |
| Malaysians | 37.1 /100 | #182 | Fair 79.5% |
| Immigrants | Hungary | 36.8 /100 | #183 | Fair 79.5% |
| Finns | 35.9 /100 | #184 | Fair 79.5% |
| Israelis | 34.7 /100 | #185 | Fair 79.5% |
| Northern Europeans | 34.5 /100 | #186 | Fair 79.5% |
| Assyrians/Chaldeans/Syriacs | 33.3 /100 | #187 | Fair 79.4% |
| Immigrants | Haiti | 32.1 /100 | #188 | Fair 79.4% |
| Immigrants | El Salvador | 30.9 /100 | #189 | Fair 79.4% |
| Immigrants | Syria | 30.8 /100 | #190 | Fair 79.4% |
| Swiss | 28.9 /100 | #191 | Fair 79.4% |
| Immigrants | Denmark | 26.9 /100 | #192 | Fair 79.4% |
Demographics Similar to Central American Indians by In Labor Force | Age 20-64
In terms of in labor force | age 20-64, the demographic groups most similar to Central American Indians are Alaska Native (77.0%, a difference of 0.060%), American (77.0%, a difference of 0.060%), Comanche (77.0%, a difference of 0.080%), Blackfeet (77.0%, a difference of 0.11%), and Potawatomi (77.2%, a difference of 0.17%).
| Demographics | Rating | Rank | In Labor Force | Age 20-64 |
| Spanish American Indians | 0.0 /100 | #300 | Tragic 77.6% |
| Nepalese | 0.0 /100 | #301 | Tragic 77.5% |
| Iroquois | 0.0 /100 | #302 | Tragic 77.5% |
| Chippewa | 0.0 /100 | #303 | Tragic 77.3% |
| Immigrants | Mexico | 0.0 /100 | #304 | Tragic 77.3% |
| Mexicans | 0.0 /100 | #305 | Tragic 77.2% |
| Potawatomi | 0.0 /100 | #306 | Tragic 77.2% |
| Central American Indians | 0.0 /100 | #307 | Tragic 77.1% |
| Alaska Natives | 0.0 /100 | #308 | Tragic 77.0% |
| Americans | 0.0 /100 | #309 | Tragic 77.0% |
| Comanche | 0.0 /100 | #310 | Tragic 77.0% |
| Blackfeet | 0.0 /100 | #311 | Tragic 77.0% |
| Alaskan Athabascans | 0.0 /100 | #312 | Tragic 76.9% |
| Shoshone | 0.0 /100 | #313 | Tragic 76.8% |
| Blacks/African Americans | 0.0 /100 | #314 | Tragic 76.8% |