Israeli vs Central American Indian 10th Grade
COMPARE
Israeli
Central American Indian
10th Grade
10th Grade Comparison
Israelis
Central American Indians
94.3%
10TH GRADE
93.8/ 100
METRIC RATING
127th/ 347
METRIC RANK
89.7%
10TH GRADE
0.0/ 100
METRIC RATING
326th/ 347
METRIC RANK
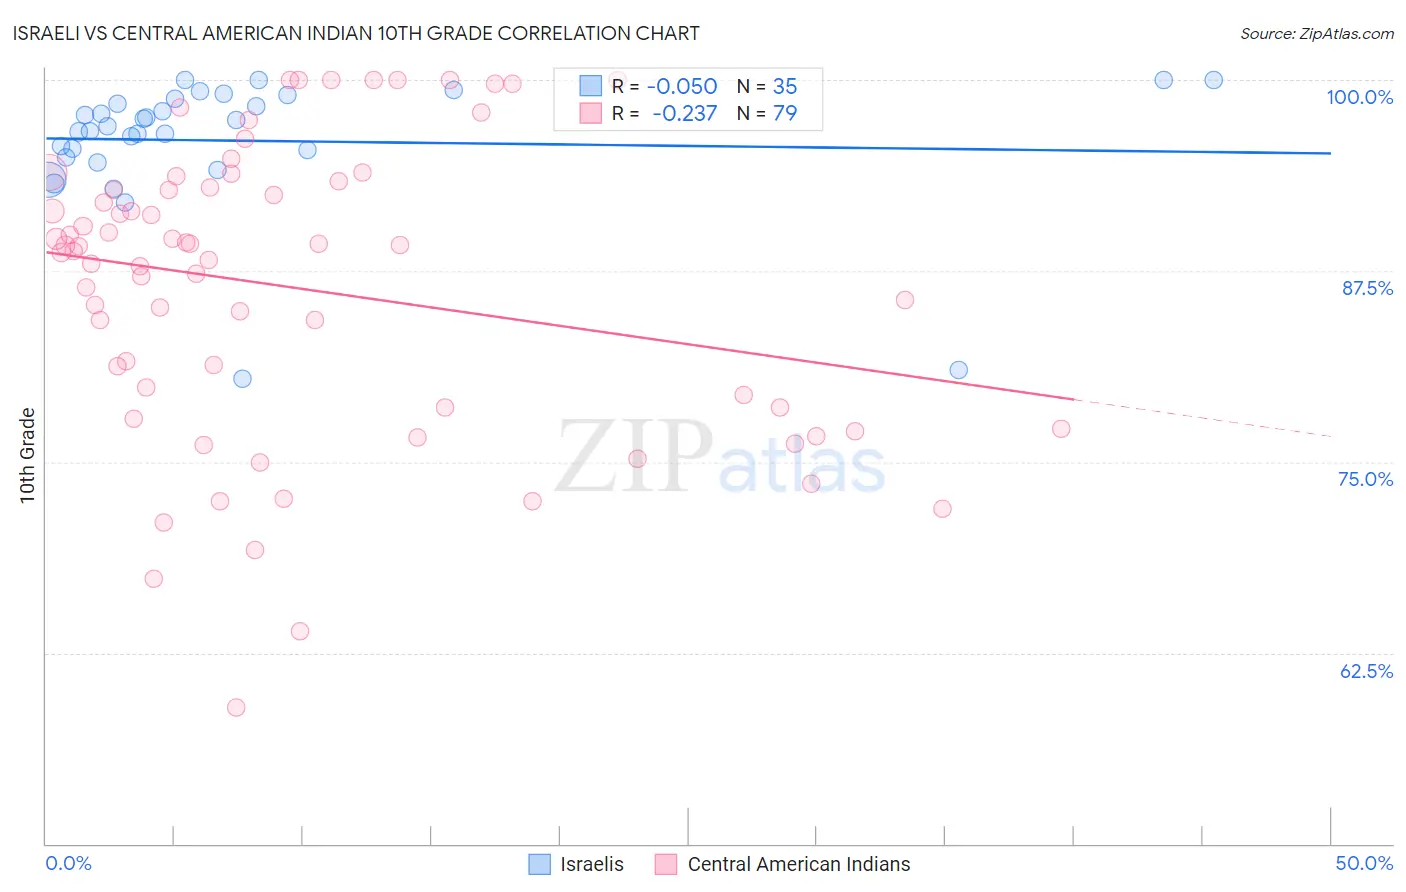
Israeli vs Central American Indian 10th Grade Correlation Chart
The statistical analysis conducted on geographies consisting of 211,220,151 people shows no correlation between the proportion of Israelis and percentage of population with at least 10th grade education in the United States with a correlation coefficient (R) of -0.050 and weighted average of 94.3%. Similarly, the statistical analysis conducted on geographies consisting of 326,142,643 people shows a weak negative correlation between the proportion of Central American Indians and percentage of population with at least 10th grade education in the United States with a correlation coefficient (R) of -0.237 and weighted average of 89.7%, a difference of 5.1%.
10th Grade Correlation Summary
| Measurement | Israeli | Central American Indian |
| Minimum | 80.4% | 58.9% |
| Maximum | 100.0% | 100.0% |
| Range | 19.6% | 41.1% |
| Mean | 96.0% | 86.3% |
| Median | 97.0% | 88.8% |
| Interquartile 25% (IQ1) | 95.0% | 78.5% |
| Interquartile 75% (IQ3) | 98.8% | 93.0% |
| Interquartile Range (IQR) | 3.8% | 14.4% |
| Standard Deviation (Sample) | 4.4% | 9.6% |
| Standard Deviation (Population) | 4.3% | 9.6% |
Similar Demographics by 10th Grade
Demographics Similar to Israelis by 10th Grade
In terms of 10th grade, the demographic groups most similar to Israelis are Potawatomi (94.3%, a difference of 0.010%), American (94.3%, a difference of 0.020%), Immigrants from Iran (94.3%, a difference of 0.020%), Basque (94.3%, a difference of 0.040%), and Iroquois (94.3%, a difference of 0.040%).
| Demographics | Rating | Rank | 10th Grade |
| Immigrants | Taiwan | 95.3 /100 | #120 | Exceptional 94.4% |
| Immigrants | Belarus | 95.2 /100 | #121 | Exceptional 94.4% |
| Inupiat | 95.1 /100 | #122 | Exceptional 94.4% |
| Cree | 95.1 /100 | #123 | Exceptional 94.4% |
| Basques | 94.9 /100 | #124 | Exceptional 94.3% |
| Americans | 94.4 /100 | #125 | Exceptional 94.3% |
| Immigrants | Iran | 94.4 /100 | #126 | Exceptional 94.3% |
| Israelis | 93.8 /100 | #127 | Exceptional 94.3% |
| Potawatomi | 93.6 /100 | #128 | Exceptional 94.3% |
| Iroquois | 92.8 /100 | #129 | Exceptional 94.3% |
| Immigrants | Greece | 92.7 /100 | #130 | Exceptional 94.3% |
| Immigrants | Eastern Europe | 92.5 /100 | #131 | Exceptional 94.3% |
| Immigrants | Russia | 92.4 /100 | #132 | Exceptional 94.3% |
| Creek | 91.9 /100 | #133 | Exceptional 94.2% |
| Osage | 91.7 /100 | #134 | Exceptional 94.2% |
Demographics Similar to Central American Indians by 10th Grade
In terms of 10th grade, the demographic groups most similar to Central American Indians are Puerto Rican (89.8%, a difference of 0.18%), Immigrants from Armenia (89.9%, a difference of 0.20%), Immigrants from Nicaragua (89.5%, a difference of 0.26%), Immigrants from Cabo Verde (89.5%, a difference of 0.27%), and Dominican (89.4%, a difference of 0.37%).
| Demographics | Rating | Rank | 10th Grade |
| Nicaraguans | 0.0 /100 | #319 | Tragic 90.2% |
| Houma | 0.0 /100 | #320 | Tragic 90.2% |
| Belizeans | 0.0 /100 | #321 | Tragic 90.2% |
| Tohono O'odham | 0.0 /100 | #322 | Tragic 90.1% |
| Immigrants | Belize | 0.0 /100 | #323 | Tragic 90.1% |
| Immigrants | Armenia | 0.0 /100 | #324 | Tragic 89.9% |
| Puerto Ricans | 0.0 /100 | #325 | Tragic 89.8% |
| Central American Indians | 0.0 /100 | #326 | Tragic 89.7% |
| Immigrants | Nicaragua | 0.0 /100 | #327 | Tragic 89.5% |
| Immigrants | Cabo Verde | 0.0 /100 | #328 | Tragic 89.5% |
| Dominicans | 0.0 /100 | #329 | Tragic 89.4% |
| Immigrants | Yemen | 0.0 /100 | #330 | Tragic 89.1% |
| Mexican American Indians | 0.0 /100 | #331 | Tragic 89.0% |
| Immigrants | Azores | 0.0 /100 | #332 | Tragic 89.0% |
| Hondurans | 0.0 /100 | #333 | Tragic 89.0% |