Israeli vs Central American Indian Disability Age 65 to 74
COMPARE
Israeli
Central American Indian
Disability Age 65 to 74
Disability Age 65 to 74 Comparison
Israelis
Central American Indians
21.2%
DISABILITY AGE 65 TO 74
99.8/ 100
METRIC RATING
37th/ 347
METRIC RANK
27.1%
DISABILITY AGE 65 TO 74
0.0/ 100
METRIC RATING
302nd/ 347
METRIC RANK
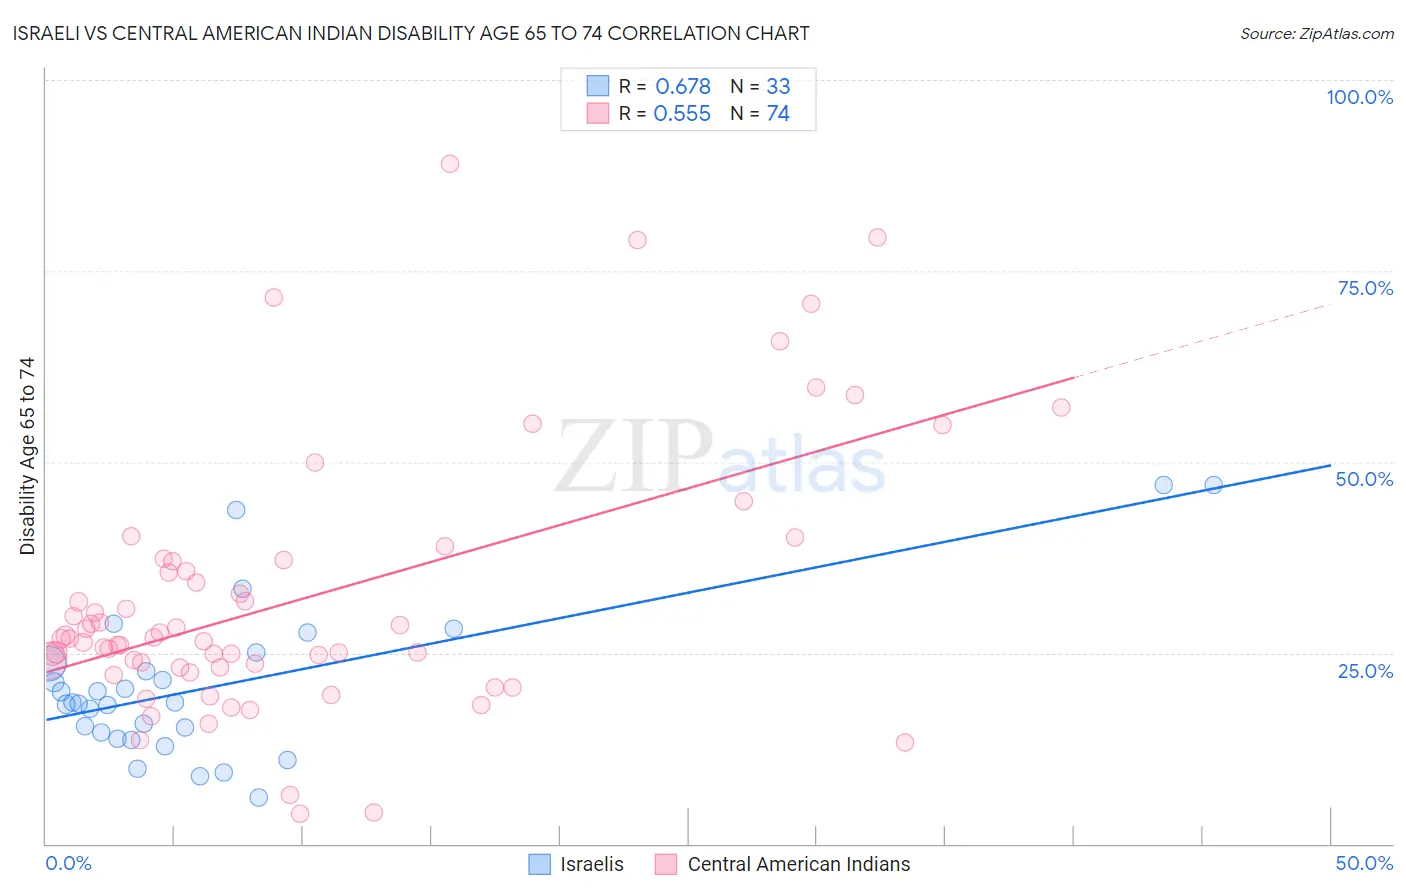
Israeli vs Central American Indian Disability Age 65 to 74 Correlation Chart
The statistical analysis conducted on geographies consisting of 210,778,329 people shows a significant positive correlation between the proportion of Israelis and percentage of population with a disability between the ages 65 and 75 in the United States with a correlation coefficient (R) of 0.678 and weighted average of 21.2%. Similarly, the statistical analysis conducted on geographies consisting of 325,736,526 people shows a substantial positive correlation between the proportion of Central American Indians and percentage of population with a disability between the ages 65 and 75 in the United States with a correlation coefficient (R) of 0.555 and weighted average of 27.1%, a difference of 28.1%.
Disability Age 65 to 74 Correlation Summary
| Measurement | Israeli | Central American Indian |
| Minimum | 6.1% | 3.9% |
| Maximum | 46.9% | 89.0% |
| Range | 40.8% | 85.1% |
| Mean | 20.8% | 32.2% |
| Median | 18.5% | 26.9% |
| Interquartile 25% (IQ1) | 14.2% | 23.1% |
| Interquartile 75% (IQ3) | 24.3% | 37.0% |
| Interquartile Range (IQR) | 10.1% | 13.9% |
| Standard Deviation (Sample) | 10.1% | 17.4% |
| Standard Deviation (Population) | 10.0% | 17.2% |
Similar Demographics by Disability Age 65 to 74
Demographics Similar to Israelis by Disability Age 65 to 74
In terms of disability age 65 to 74, the demographic groups most similar to Israelis are Russian (21.2%, a difference of 0.0%), Immigrants from Switzerland (21.1%, a difference of 0.11%), Argentinean (21.2%, a difference of 0.19%), Bulgarian (21.1%, a difference of 0.30%), and Latvian (21.2%, a difference of 0.35%).
| Demographics | Rating | Rank | Disability Age 65 to 74 |
| Immigrants | Greece | 99.9 /100 | #30 | Exceptional 21.0% |
| Immigrants | Northern Europe | 99.9 /100 | #31 | Exceptional 21.0% |
| Turks | 99.9 /100 | #32 | Exceptional 21.0% |
| Immigrants | Argentina | 99.9 /100 | #33 | Exceptional 21.1% |
| Immigrants | Sri Lanka | 99.9 /100 | #34 | Exceptional 21.1% |
| Bulgarians | 99.9 /100 | #35 | Exceptional 21.1% |
| Immigrants | Switzerland | 99.8 /100 | #36 | Exceptional 21.1% |
| Israelis | 99.8 /100 | #37 | Exceptional 21.2% |
| Russians | 99.8 /100 | #38 | Exceptional 21.2% |
| Argentineans | 99.8 /100 | #39 | Exceptional 21.2% |
| Latvians | 99.8 /100 | #40 | Exceptional 21.2% |
| Immigrants | Austria | 99.8 /100 | #41 | Exceptional 21.2% |
| Macedonians | 99.7 /100 | #42 | Exceptional 21.3% |
| Immigrants | Croatia | 99.7 /100 | #43 | Exceptional 21.3% |
| Estonians | 99.7 /100 | #44 | Exceptional 21.4% |
Demographics Similar to Central American Indians by Disability Age 65 to 74
In terms of disability age 65 to 74, the demographic groups most similar to Central American Indians are Immigrants from Mexico (27.1%, a difference of 0.010%), Tlingit-Haida (27.1%, a difference of 0.060%), Puget Sound Salish (27.2%, a difference of 0.18%), Mexican (27.2%, a difference of 0.28%), and Immigrants from Dominican Republic (27.0%, a difference of 0.33%).
| Demographics | Rating | Rank | Disability Age 65 to 74 |
| Hispanics or Latinos | 0.0 /100 | #295 | Tragic 26.7% |
| Bangladeshis | 0.0 /100 | #296 | Tragic 26.8% |
| Fijians | 0.0 /100 | #297 | Tragic 27.0% |
| Immigrants | Yemen | 0.0 /100 | #298 | Tragic 27.0% |
| Potawatomi | 0.0 /100 | #299 | Tragic 27.0% |
| Immigrants | Dominican Republic | 0.0 /100 | #300 | Tragic 27.0% |
| Immigrants | Mexico | 0.0 /100 | #301 | Tragic 27.1% |
| Central American Indians | 0.0 /100 | #302 | Tragic 27.1% |
| Tlingit-Haida | 0.0 /100 | #303 | Tragic 27.1% |
| Puget Sound Salish | 0.0 /100 | #304 | Tragic 27.2% |
| Mexicans | 0.0 /100 | #305 | Tragic 27.2% |
| Blacks/African Americans | 0.0 /100 | #306 | Tragic 27.3% |
| Ute | 0.0 /100 | #307 | Tragic 27.3% |
| Sioux | 0.0 /100 | #308 | Tragic 27.3% |
| Yaqui | 0.0 /100 | #309 | Tragic 27.4% |