Egyptian vs Central American Indian In Labor Force | Age 20-64
COMPARE
Egyptian
Central American Indian
In Labor Force | Age 20-64
In Labor Force | Age 20-64 Comparison
Egyptians
Central American Indians
80.2%
IN LABOR FORCE | AGE 20-64
97.8/ 100
METRIC RATING
76th/ 347
METRIC RANK
77.1%
IN LABOR FORCE | AGE 20-64
0.0/ 100
METRIC RATING
307th/ 347
METRIC RANK
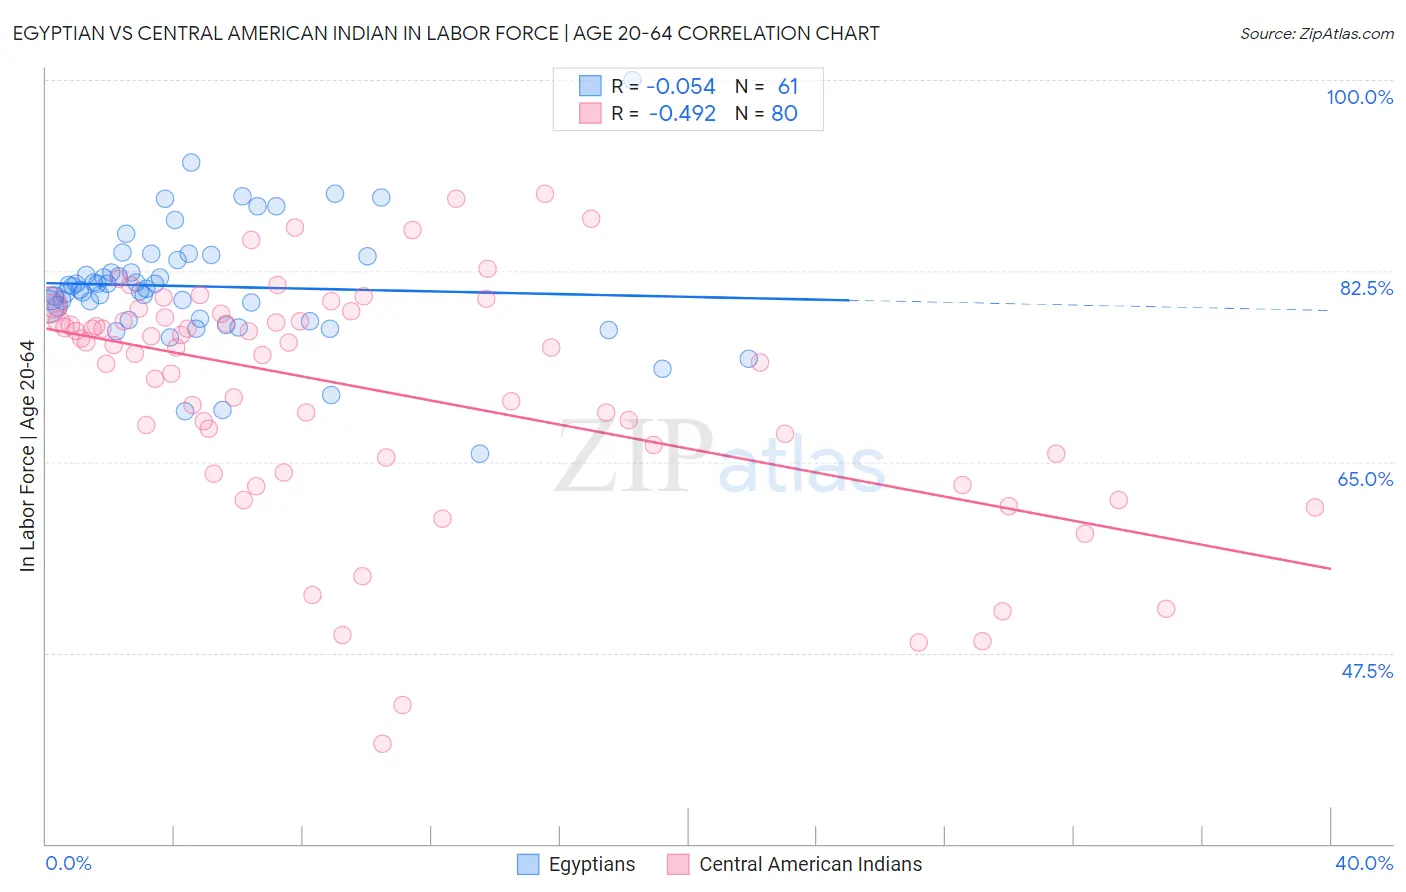
Egyptian vs Central American Indian In Labor Force | Age 20-64 Correlation Chart
The statistical analysis conducted on geographies consisting of 276,929,100 people shows a slight negative correlation between the proportion of Egyptians and labor force participation rate among population between the ages 20 and 64 in the United States with a correlation coefficient (R) of -0.054 and weighted average of 80.2%. Similarly, the statistical analysis conducted on geographies consisting of 326,143,757 people shows a moderate negative correlation between the proportion of Central American Indians and labor force participation rate among population between the ages 20 and 64 in the United States with a correlation coefficient (R) of -0.492 and weighted average of 77.1%, a difference of 4.0%.
In Labor Force | Age 20-64 Correlation Summary
| Measurement | Egyptian | Central American Indian |
| Minimum | 65.8% | 39.2% |
| Maximum | 100.0% | 89.6% |
| Range | 34.2% | 50.4% |
| Mean | 81.1% | 71.6% |
| Median | 80.9% | 75.6% |
| Interquartile 25% (IQ1) | 78.1% | 65.6% |
| Interquartile 75% (IQ3) | 83.6% | 78.4% |
| Interquartile Range (IQR) | 5.6% | 12.7% |
| Standard Deviation (Sample) | 5.5% | 10.9% |
| Standard Deviation (Population) | 5.5% | 10.8% |
Similar Demographics by In Labor Force | Age 20-64
Demographics Similar to Egyptians by In Labor Force | Age 20-64
In terms of in labor force | age 20-64, the demographic groups most similar to Egyptians are Immigrants from Colombia (80.2%, a difference of 0.0%), Immigrants from Romania (80.2%, a difference of 0.0%), Immigrants from Afghanistan (80.2%, a difference of 0.010%), Asian (80.2%, a difference of 0.010%), and Immigrants from Croatia (80.1%, a difference of 0.020%).
| Demographics | Rating | Rank | In Labor Force | Age 20-64 |
| Albanians | 98.6 /100 | #69 | Exceptional 80.2% |
| Immigrants | Turkey | 98.5 /100 | #70 | Exceptional 80.2% |
| Soviet Union | 98.5 /100 | #71 | Exceptional 80.2% |
| Eastern Europeans | 98.4 /100 | #72 | Exceptional 80.2% |
| Cypriots | 98.2 /100 | #73 | Exceptional 80.2% |
| Immigrants | Eastern Europe | 98.1 /100 | #74 | Exceptional 80.2% |
| Immigrants | Afghanistan | 97.9 /100 | #75 | Exceptional 80.2% |
| Egyptians | 97.8 /100 | #76 | Exceptional 80.2% |
| Immigrants | Colombia | 97.8 /100 | #77 | Exceptional 80.2% |
| Immigrants | Romania | 97.8 /100 | #78 | Exceptional 80.2% |
| Asians | 97.7 /100 | #79 | Exceptional 80.2% |
| Immigrants | Croatia | 97.6 /100 | #80 | Exceptional 80.1% |
| German Russians | 97.3 /100 | #81 | Exceptional 80.1% |
| Immigrants | Japan | 97.3 /100 | #82 | Exceptional 80.1% |
| Colombians | 97.3 /100 | #83 | Exceptional 80.1% |
Demographics Similar to Central American Indians by In Labor Force | Age 20-64
In terms of in labor force | age 20-64, the demographic groups most similar to Central American Indians are Alaska Native (77.0%, a difference of 0.060%), American (77.0%, a difference of 0.060%), Comanche (77.0%, a difference of 0.080%), Blackfeet (77.0%, a difference of 0.11%), and Potawatomi (77.2%, a difference of 0.17%).
| Demographics | Rating | Rank | In Labor Force | Age 20-64 |
| Spanish American Indians | 0.0 /100 | #300 | Tragic 77.6% |
| Nepalese | 0.0 /100 | #301 | Tragic 77.5% |
| Iroquois | 0.0 /100 | #302 | Tragic 77.5% |
| Chippewa | 0.0 /100 | #303 | Tragic 77.3% |
| Immigrants | Mexico | 0.0 /100 | #304 | Tragic 77.3% |
| Mexicans | 0.0 /100 | #305 | Tragic 77.2% |
| Potawatomi | 0.0 /100 | #306 | Tragic 77.2% |
| Central American Indians | 0.0 /100 | #307 | Tragic 77.1% |
| Alaska Natives | 0.0 /100 | #308 | Tragic 77.0% |
| Americans | 0.0 /100 | #309 | Tragic 77.0% |
| Comanche | 0.0 /100 | #310 | Tragic 77.0% |
| Blackfeet | 0.0 /100 | #311 | Tragic 77.0% |
| Alaskan Athabascans | 0.0 /100 | #312 | Tragic 76.9% |
| Shoshone | 0.0 /100 | #313 | Tragic 76.8% |
| Blacks/African Americans | 0.0 /100 | #314 | Tragic 76.8% |