Iroquois vs Icelander In Labor Force | Age 25-29
COMPARE
Iroquois
Icelander
In Labor Force | Age 25-29
In Labor Force | Age 25-29 Comparison
Iroquois
Icelanders
83.8%
IN LABOR FORCE | AGE 25-29
0.4/ 100
METRIC RATING
245th/ 347
METRIC RANK
84.8%
IN LABOR FORCE | AGE 25-29
68.2/ 100
METRIC RATING
146th/ 347
METRIC RANK
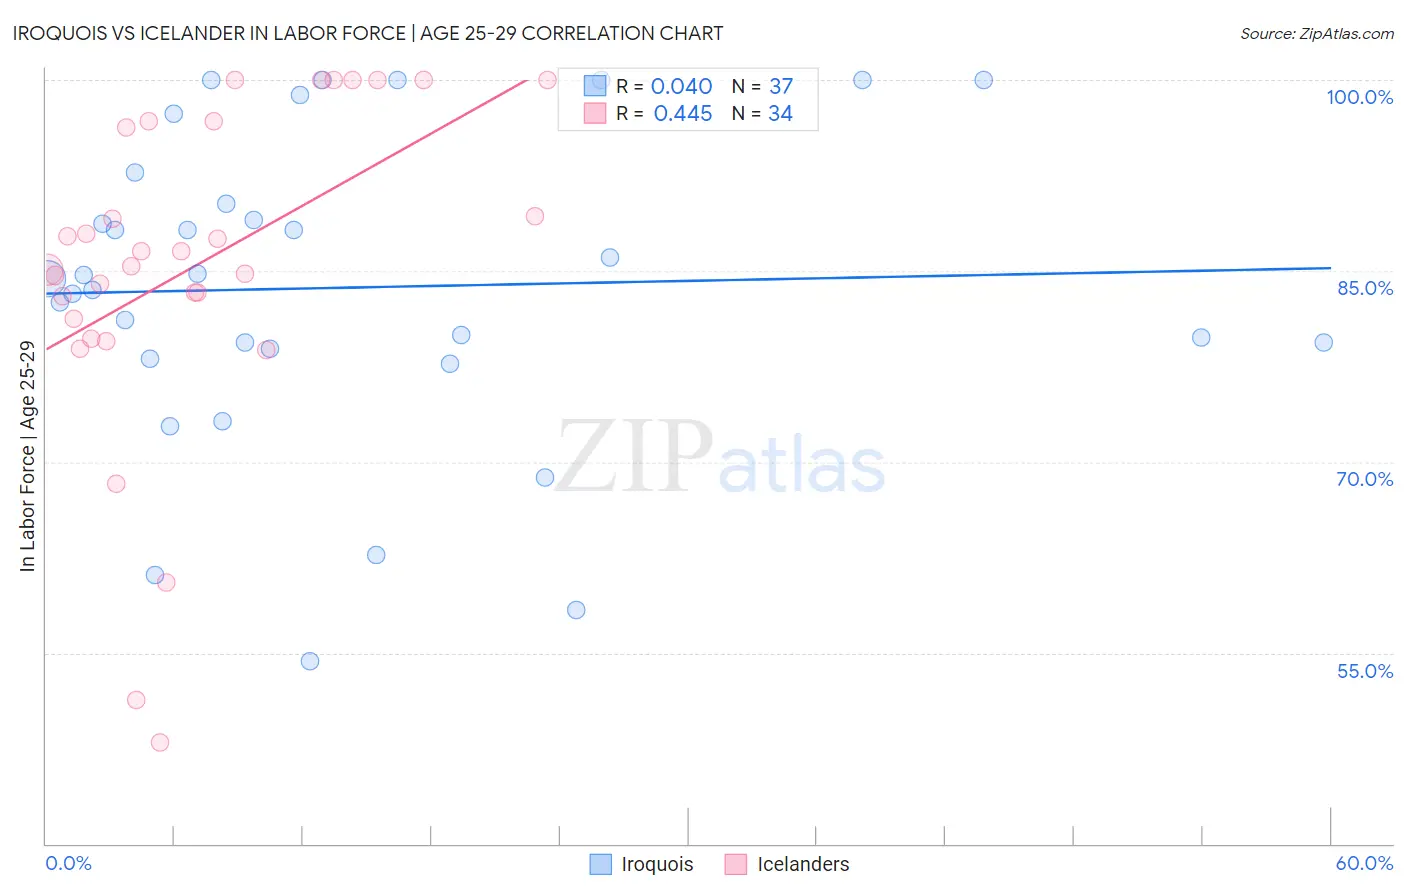
Iroquois vs Icelander In Labor Force | Age 25-29 Correlation Chart
The statistical analysis conducted on geographies consisting of 207,267,348 people shows no correlation between the proportion of Iroquois and labor force participation rate among population between the ages 25 and 29 in the United States with a correlation coefficient (R) of 0.040 and weighted average of 83.8%. Similarly, the statistical analysis conducted on geographies consisting of 159,638,319 people shows a moderate positive correlation between the proportion of Icelanders and labor force participation rate among population between the ages 25 and 29 in the United States with a correlation coefficient (R) of 0.445 and weighted average of 84.8%, a difference of 1.2%.
In Labor Force | Age 25-29 Correlation Summary
| Measurement | Iroquois | Icelander |
| Minimum | 54.3% | 48.0% |
| Maximum | 100.0% | 100.0% |
| Range | 45.7% | 52.0% |
| Mean | 83.7% | 85.4% |
| Median | 84.4% | 85.9% |
| Interquartile 25% (IQ1) | 78.5% | 81.2% |
| Interquartile 75% (IQ3) | 91.5% | 96.7% |
| Interquartile Range (IQR) | 13.0% | 15.5% |
| Standard Deviation (Sample) | 12.2% | 13.0% |
| Standard Deviation (Population) | 12.0% | 12.8% |
Similar Demographics by In Labor Force | Age 25-29
Demographics Similar to Iroquois by In Labor Force | Age 25-29
In terms of in labor force | age 25-29, the demographic groups most similar to Iroquois are Immigrants from Jamaica (83.8%, a difference of 0.0%), Salvadoran (83.8%, a difference of 0.040%), U.S. Virgin Islander (83.8%, a difference of 0.050%), Cree (83.8%, a difference of 0.050%), and Immigrants from El Salvador (83.7%, a difference of 0.070%).
| Demographics | Rating | Rank | In Labor Force | Age 25-29 |
| Immigrants | Uzbekistan | 0.8 /100 | #238 | Tragic 83.9% |
| Jamaicans | 0.8 /100 | #239 | Tragic 83.9% |
| Trinidadians and Tobagonians | 0.7 /100 | #240 | Tragic 83.9% |
| Alsatians | 0.7 /100 | #241 | Tragic 83.9% |
| U.S. Virgin Islanders | 0.6 /100 | #242 | Tragic 83.8% |
| Salvadorans | 0.5 /100 | #243 | Tragic 83.8% |
| Immigrants | Jamaica | 0.4 /100 | #244 | Tragic 83.8% |
| Iroquois | 0.4 /100 | #245 | Tragic 83.8% |
| Cree | 0.3 /100 | #246 | Tragic 83.8% |
| Immigrants | El Salvador | 0.3 /100 | #247 | Tragic 83.7% |
| Immigrants | Nonimmigrants | 0.3 /100 | #248 | Tragic 83.7% |
| Hmong | 0.3 /100 | #249 | Tragic 83.7% |
| Central Americans | 0.2 /100 | #250 | Tragic 83.7% |
| Bahamians | 0.2 /100 | #251 | Tragic 83.7% |
| Guatemalans | 0.2 /100 | #252 | Tragic 83.7% |
Demographics Similar to Icelanders by In Labor Force | Age 25-29
In terms of in labor force | age 25-29, the demographic groups most similar to Icelanders are Immigrants from Senegal (84.8%, a difference of 0.0%), Immigrants from Asia (84.8%, a difference of 0.0%), Sri Lankan (84.8%, a difference of 0.010%), Immigrants from Laos (84.8%, a difference of 0.010%), and Pakistani (84.8%, a difference of 0.020%).
| Demographics | Rating | Rank | In Labor Force | Age 25-29 |
| Immigrants | Eastern Asia | 72.6 /100 | #139 | Good 84.8% |
| Immigrants | North America | 72.1 /100 | #140 | Good 84.8% |
| Danes | 71.9 /100 | #141 | Good 84.8% |
| Pakistanis | 70.0 /100 | #142 | Good 84.8% |
| Sri Lankans | 69.2 /100 | #143 | Good 84.8% |
| Immigrants | Laos | 69.0 /100 | #144 | Good 84.8% |
| Immigrants | Senegal | 68.3 /100 | #145 | Good 84.8% |
| Icelanders | 68.2 /100 | #146 | Good 84.8% |
| Immigrants | Asia | 68.2 /100 | #147 | Good 84.8% |
| Immigrants | England | 65.2 /100 | #148 | Good 84.7% |
| Peruvians | 64.7 /100 | #149 | Good 84.7% |
| Swiss | 64.7 /100 | #150 | Good 84.7% |
| Colombians | 62.8 /100 | #151 | Good 84.7% |
| Immigrants | Pakistan | 62.7 /100 | #152 | Good 84.7% |
| Immigrants | Taiwan | 62.2 /100 | #153 | Good 84.7% |