Iroquois vs Immigrants from Middle Africa In Labor Force | Age 20-24
COMPARE
Iroquois
Immigrants from Middle Africa
In Labor Force | Age 20-24
In Labor Force | Age 20-24 Comparison
Iroquois
Immigrants from Middle Africa
75.6%
IN LABOR FORCE | AGE 20-24
89.1/ 100
METRIC RATING
129th/ 347
METRIC RANK
76.6%
IN LABOR FORCE | AGE 20-24
99.7/ 100
METRIC RATING
75th/ 347
METRIC RANK
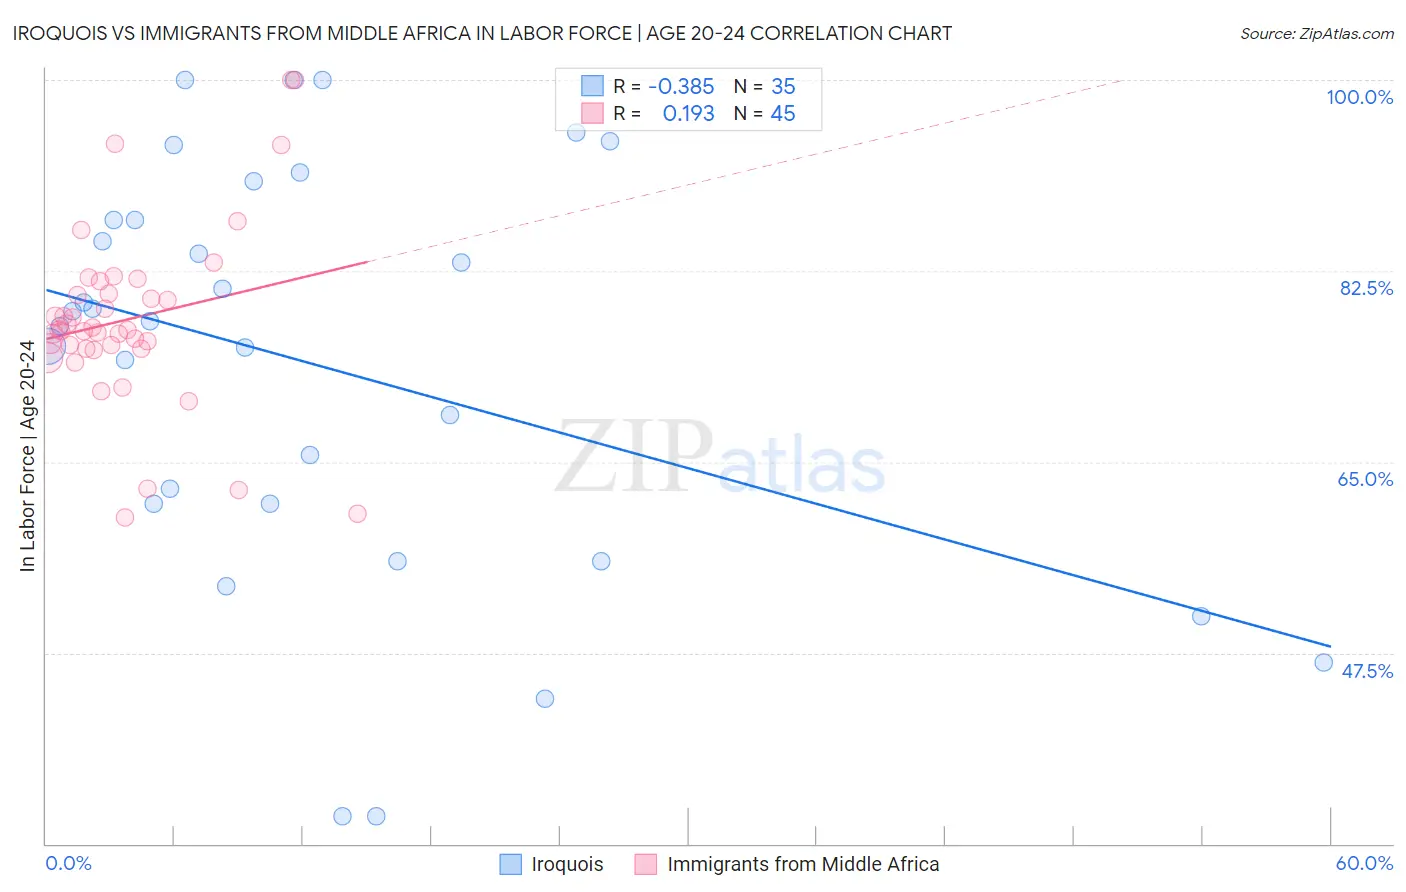
Iroquois vs Immigrants from Middle Africa In Labor Force | Age 20-24 Correlation Chart
The statistical analysis conducted on geographies consisting of 207,263,763 people shows a mild negative correlation between the proportion of Iroquois and labor force participation rate among population between the ages 20 and 24 in the United States with a correlation coefficient (R) of -0.385 and weighted average of 75.6%. Similarly, the statistical analysis conducted on geographies consisting of 202,727,179 people shows a poor positive correlation between the proportion of Immigrants from Middle Africa and labor force participation rate among population between the ages 20 and 24 in the United States with a correlation coefficient (R) of 0.193 and weighted average of 76.6%, a difference of 1.3%.
In Labor Force | Age 20-24 Correlation Summary
| Measurement | Iroquois | Immigrants from Middle Africa |
| Minimum | 32.5% | 59.9% |
| Maximum | 100.0% | 100.0% |
| Range | 67.5% | 40.1% |
| Mean | 73.8% | 78.1% |
| Median | 77.9% | 77.1% |
| Interquartile 25% (IQ1) | 61.2% | 75.4% |
| Interquartile 75% (IQ3) | 87.2% | 81.0% |
| Interquartile Range (IQR) | 26.0% | 5.6% |
| Standard Deviation (Sample) | 18.8% | 8.4% |
| Standard Deviation (Population) | 18.5% | 8.3% |
Similar Demographics by In Labor Force | Age 20-24
Demographics Similar to Iroquois by In Labor Force | Age 20-24
In terms of in labor force | age 20-24, the demographic groups most similar to Iroquois are Immigrants from Afghanistan (75.6%, a difference of 0.010%), Immigrants from Austria (75.6%, a difference of 0.010%), Immigrants from Jordan (75.6%, a difference of 0.020%), Palestinian (75.6%, a difference of 0.020%), and Zimbabwean (75.6%, a difference of 0.030%).
| Demographics | Rating | Rank | In Labor Force | Age 20-24 |
| Pakistanis | 94.1 /100 | #122 | Exceptional 75.8% |
| Immigrants | Bulgaria | 94.1 /100 | #123 | Exceptional 75.8% |
| Immigrants | Sierra Leone | 93.8 /100 | #124 | Exceptional 75.8% |
| Immigrants | Scotland | 93.7 /100 | #125 | Exceptional 75.8% |
| Brazilians | 93.0 /100 | #126 | Exceptional 75.8% |
| Sub-Saharan Africans | 90.9 /100 | #127 | Exceptional 75.7% |
| Immigrants | Afghanistan | 89.4 /100 | #128 | Excellent 75.6% |
| Iroquois | 89.1 /100 | #129 | Excellent 75.6% |
| Immigrants | Austria | 88.8 /100 | #130 | Excellent 75.6% |
| Immigrants | Jordan | 88.5 /100 | #131 | Excellent 75.6% |
| Palestinians | 88.4 /100 | #132 | Excellent 75.6% |
| Zimbabweans | 88.2 /100 | #133 | Excellent 75.6% |
| Estonians | 87.1 /100 | #134 | Excellent 75.6% |
| Yaqui | 85.5 /100 | #135 | Excellent 75.5% |
| Immigrants | Brazil | 84.8 /100 | #136 | Excellent 75.5% |
Demographics Similar to Immigrants from Middle Africa by In Labor Force | Age 20-24
In terms of in labor force | age 20-24, the demographic groups most similar to Immigrants from Middle Africa are Cree (76.6%, a difference of 0.020%), Immigrants from Moldova (76.6%, a difference of 0.040%), Immigrants from Cameroon (76.6%, a difference of 0.070%), Canadian (76.6%, a difference of 0.070%), and British (76.7%, a difference of 0.090%).
| Demographics | Rating | Rank | In Labor Force | Age 20-24 |
| French American Indians | 99.8 /100 | #68 | Exceptional 76.8% |
| Immigrants | Sudan | 99.8 /100 | #69 | Exceptional 76.8% |
| Ottawa | 99.8 /100 | #70 | Exceptional 76.8% |
| Northern Europeans | 99.8 /100 | #71 | Exceptional 76.8% |
| Guamanians/Chamorros | 99.8 /100 | #72 | Exceptional 76.7% |
| British | 99.8 /100 | #73 | Exceptional 76.7% |
| Cree | 99.7 /100 | #74 | Exceptional 76.6% |
| Immigrants | Middle Africa | 99.7 /100 | #75 | Exceptional 76.6% |
| Immigrants | Moldova | 99.6 /100 | #76 | Exceptional 76.6% |
| Immigrants | Cameroon | 99.6 /100 | #77 | Exceptional 76.6% |
| Canadians | 99.6 /100 | #78 | Exceptional 76.6% |
| Immigrants | Zaire | 99.6 /100 | #79 | Exceptional 76.6% |
| Italians | 99.6 /100 | #80 | Exceptional 76.5% |
| Basques | 99.5 /100 | #81 | Exceptional 76.5% |
| Hmong | 99.5 /100 | #82 | Exceptional 76.5% |